Table of Content
8 Best Technical Indicators for Options Trading | Beginner's Guide
By Vincent NguyenUpdated 400 days ago

Best technical indicators for options trading
When it comes to trading options, employing the Best technical indicators for options trading can make the difference between a successful trade and one that never gets off the ground. Options traders face unique challenges compared to stock traders time decay, strike price choices, and the possibility of multiple option trading strategies complicate the picture. Meanwhile, market volatility can spike with no warning, and false signals abound if you rely on a single indicator or ignore crucial technical analysis tools.
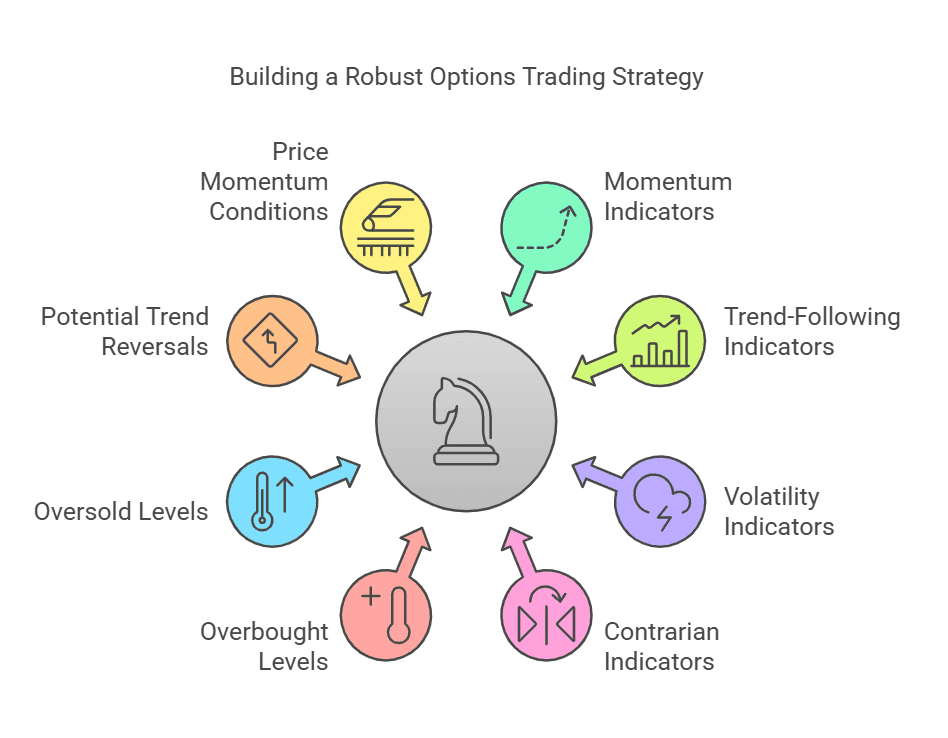
This guide will help you build a robust framework for reading price charts and interpreting price action, so you can place option positions that align with your investment objectives, trading style, and risk management plan. We will walk through eight indicators. Each belongs to a particular family of technical indicators such as momentum indicators, trend-following indicators, volatility indicators, or contrarian indicators. We’ll also discuss how they can reveal overbought levels, oversold levels, potential trend reversals, and price momentum conditions.
Below, you’ll find explanations of each indicator, guidance on how to interpret it, and suggestions on how to incorporate it into an option trading strategy. Because options allow you to profit from multiple market directions upward trend, downward trend, or sideways movement the right technical analysis indicators can help you choose the correct method of trade and put you in the best position for profit.
Let’s dive in.
Bollinger Bands: Among the Best technical indicators for options trading
Bollinger Bands measure market volatility by plotting three lines (bands) based on a moving average and its standard deviation. They help options traders identify overbought levels or oversold levels, spot a potential reversal, and gauge when market conditions are unusually calm or volatile.
What Are Bollinger Bands?
Developed by John Bollinger, Bollinger Bands consist of three lines:
- Middle Band: This is typically a 20-day simple moving average (SMA), although the common period can be adjusted.
- Upper Band: Plotted a certain number of standard deviation units above the middle band.
- Lower Band: (sometimes called the outer Band): Plotted the same number of standard deviation units below the middle band.
These bands expand and contract as market volatility changes. When volatility is high, the bands widen; when volatility is low, the bands narrow.
Why Bollinger Bands for Options Traders?
- Identify Overbought or Oversold Conditions: When share prices or an asset price hovers near the upper band for a sustained period of time, it can indicate overbought conditions and a potential price correction. Conversely, if the price stays near the lower band, it may indicate oversold conditions and a chance for a bullish reversal.
- Gauge Market Volatility: Options premiums are heavily influenced by volatility. If the Bollinger Bands start to “squeeze” or tighten, it might mean that market volatility will soon rise—this can help you decide whether it’s a good time to implement a volatility-dependent options method (like a straddle or a strangle).
- Find Potential Breakouts: A sudden price movement outside of the upper band can signal a strong trend, while a move below the lower band might indicate a downward trend or bearish sentiment. Either scenario can lead to potential trend reversals.
How to Use Bollinger Bands Effectively
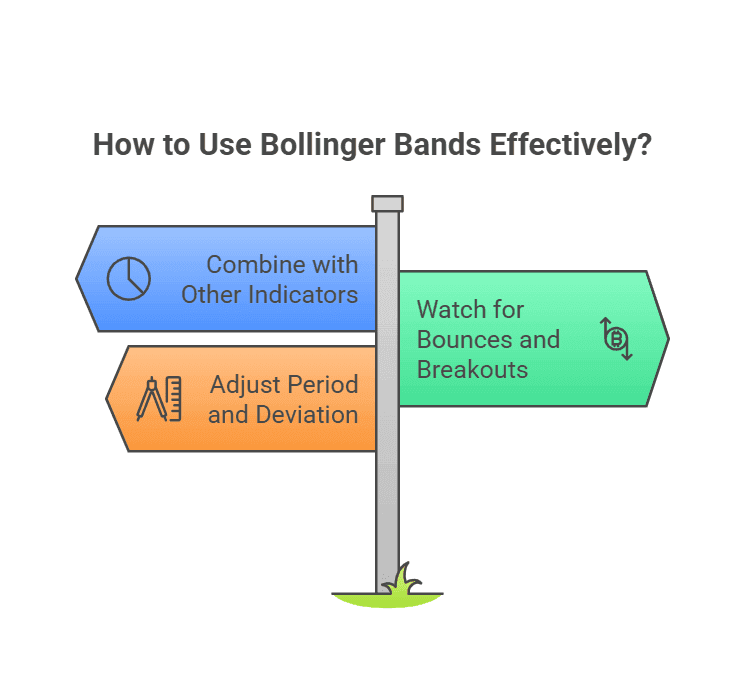
- Combine with Other Indicators: Because Bollinger Bands are volatility indicators, you should also look at momentum indicators like RSI or MACD to confirm bullish crossover or bearish signals.
- Watch for Bollinger “Bounces” and “Breakouts”: Price sometimes bounces between the upper and lower band in range-bound market conditions. A breakout beyond either band, with high volume, can be a sign of an upcoming price swing.
- Adjust Your Period of Time & Deviation: Many traders stick to the 20-day SMA and 2 standard deviations, but adjusting these settings can tailor the indicator to your trading style or the time period you’re analyzing (e.g., intraday moves vs. multi-day trades).

RSI: Why It’s One of the Best technical indicators for options trading
The Relative Strength Index (RSI) is a momentum oscillator that helps traders identify overbought levels and oversold levels in the market, signaling when the price moves might be exhausted or due for a potential reversal.
What Is RSI?
Developed by J. Welles Wilder, RSI ranges from 0 to 100:
- Readings above 70 often suggest overbought conditions.
- Readings below 30 often point to oversold conditions.
Why RSI for Options?
- Momentum Indicator: RSI is among the most straightforward indicators for options trading. It tells you if the current price momentum is robust or fading—crucial for short-term trading, whether you’re opening binary option contracts or standard monthly options.
- Catch Potential Trend Reversals: An RSI nearing extreme levels can warn of a price reversal—useful information if you’re about to choose a strike price based on bullish sentiment or bearish sentiment.
- Divergence Signals: Divergences between price and RSI (e.g., when price forms higher highs while RSI fails to do so) can indicate lack of momentum and a coming change in market direction.
Tips for Using RSI
- Pair with a Trend-Following Indicator: On its own, RSI can yield false signals if the market is in a strong trend. Combining it with a moving average or MACD can enhance reliability.
- Adjust Periods: The standard RSI setting is a 14-day period, but you may choose a shorter period (e.g., 9-day RSI) if you engage in intraday trading or 5-minute options trading.
- Watch for RSI Reversals: Typically, you’ll wait for the RSI to come back from an extreme reading (e.g., from above 70 back down below 70) to confirm a reversal in price trends.
Stochastic Oscillator: Another of the Best technical indicators for options trading
The Stochastic Oscillator is another momentum indicator that compares a stock’s closing price to its price range over a specific period of time. It is considered a leading indicator that can generate relatively rapid signals for option trading indicators.
How Does Stochastic Oscillator Work?
- Ranges from 0 to 100, like RSI.
- Readings above 80 suggest possible overbought conditions.
- Readings below 20 suggest possible oversold conditions.
- A stochastic crossover between %K and %D lines often signals a trend direction change, or at least a shorter-term price swing.
Why Stochastic Oscillator for Options Traders?
- Overbought/Oversold Clues: Similar to RSI, the Stochastic Oscillator helps you identify when a share price might be ripe for reversal.
- Short-Term Trading: Because it reacts quickly to price fluctuations, it suits intraday moves and options with strike prices aimed at capturing short swings.
- Divergences: Like RSI, you can look for divergences between the oscillator and price chart to anticipate a potential reversal or the end of a bullish momentum wave.
Best Practices
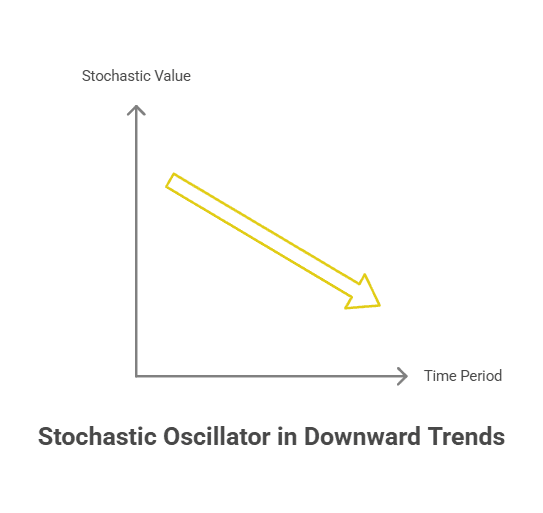
- Use with Caution in Strong Trends: In a strong trend, the Stochastic can stay overbought or oversold for an extended period, leading to conflicting signals.
- Combine with Other Tools: The Stochastic Oscillator works well with trend-following indicators like Moving Averages. Wait for a sell signal on the Stochastic to coincide with a downward trend in price for extra confirmation.

The Put-Call Ratio: An Essential Measure of Market Sentiment
The Put-Call Ratio compares the volume of traded put options to call options. It’s often viewed as a contrarian indicator because extreme highs or lows in this ratio can signal shifts in market sentiment.
How to Calculate the Put-Call Ratio
- PCR = (Number of traded put options) / (Number of traded call options).
- A reading above 1 typically means puts outnumber calls, reflecting a more bearish sentiment.
- A reading below 1 means calls outnumber puts, possibly indicating bullish sentiment.
Why Is the Put-Call Ratio Important?
- Contrarian Indicator: Extreme readings can suggest that the majority of traders have swung too far in one direction, prompting a potential reversal.
- Market Sentiment Gauge: High put volume can indicate protective positioning or expectation of a price drop. Low put volume might signify complacency or a fully bullish crossover in sentiment.
- Spotting Options Market Extremes: If you’re an option trader, these extremes can warn you about bearish signals or bullish momentum that could whipsaw quickly.
When to Use the Put-Call Ratio
- Confirm Broader Trends: Combine PCR with technical analysis of price trends to identify alignment.
- Contrarian Strategy: Some riskier traders open positions counter to the ratio’s extremes, especially near oversold market conditions or blow off tops.
Moving Averages: One of the Best technical indicators for options trading
Moving Averages (MAs) smooth out price action over a specified period of time, offering a simpler view of the current trend or potential trend reversals. Common types include the Simple Moving Average (SMA) and the Exponential Moving Average (EMA).
Why Moving Averages?
- Trend-Following Indicator: MAs help you identify a strong trend or a market reversal in its early stage.
- Dynamic Support/Resistance: Sometimes, the MA line acts as a resistance level in a downward trend or a support level in an upward trend.
- Common Mistakes Options Traders Make: Jumping into a trade without checking the broader trend. MAs reduce analysis paralysis by offering a clear perspective on market direction.
Popular Moving Average Variations
- Simple Moving Average (SMA): Averages the closing price over a set period of time. Often used for standard detection of trend indicators.
- Exponential Moving Average (EMA): Places more weight on recent price moves, making it more reactive to current price movements. Typically used by intraday traders or those needing rapid signals.
Interpreting Moving Average Crossovers
- A “Golden Cross” occurs when a short-term MA crosses above a long-term MA, often seen as a bullish crossover.
- A “Death Cross” occurs when a short-term MA crosses below a long-term MA, often seen as a bearish signal.
- For options trading, these crossovers can help pinpoint entry points and set a proper strike price in alignment with the market trends.
MACD: Another of the Best technical indicators for options trading
The Moving Average Convergence Divergence (MACD) combines trend-following indicators and momentum indicators into one tool. It tracks the relationship between two exponential moving averages (often the 12-day and 26-day EMAs).
Understanding MACD Components
- MACD Line: (12-day EMA – 26-day EMA).
- Signal Line: Usually a 9-day EMA of the MACD line.
- Histogram: Shows the difference between the MACD line and the Signal line.
Why MACD for Options Traders?
- Momentum + Trend: MACD’s histogram reveals increasing or decreasing momentum indicators, making it valuable for determining if a price trend will continue or if a potential reversal is likely.
- Bullish and Bearish Crossovers: A MACD line crossing above the Signal line is considered a buy signal (bullish). A crossover below is considered a sell signal (bearish).
- Divergence: Like RSI and Stochastics, a divergence between the MACD and price chart can foreshadow significant price swings.
Tips for Using MACD
- Filter Out Noise: If you’re trading short term, you can shorten the periods (e.g., 9-day and 21-day EMAs) for quicker signals.
- Combine With Volume Indicators: MACD crossovers on low volume can create false signals. Confirm with Volume Profile or On-Balance Volume if possible.
- Set Clear Exit Trades: MACD helps identify trend direction, but be sure to plan your exit if momentum stalls.
Support and Resistance: A Key Aspect of the Best technical indicators for options trading
Support and resistance levels are key indicators of where price movement may pause or reverse. They aren’t a specific formula-based indicator for options trading but are crucial to technical analysis and dovetail with many other technical indicators.
Defining Support and Resistance
- Support Levels: Price points where the asset tends to stop falling and might bounce upward.
- Resistance Levels: Price ceilings where the asset struggles to break through, often reversing downward.
Why Support and Resistance for Options Trading?
- Pinpoint Strike Prices: If a stock is near a significant resistance level and failing to break above it, you might consider a bearish option strategy. Conversely, if the current price bounces off a strong support, you might choose a bullish strategy.
- Plan Your Option Positions: Knowing loss levels (e.g., below support) and potential profit targets (e.g., near resistance) helps with position sizing and risk management.
- Combined with Momentum: If RSI or MACD signals bullish momentum near a strong support level, it may be an opportune time to open a call. On the flip side, a bearish sentiment near a heavy resistance level can be a sign to buy puts.
Tips for Using Support and Resistance
- Multiple Time Frames: Check daily, weekly, and intraday moves to ensure consistency. A level might be less significant if it only appears in a smaller time period.
- Trendlines: In addition to horizontal levels, diagonal trend lines can also indicate dynamic support or resistance in an upward trend or downward trend.
Volume Profile & On-Balance Volume (OBV): Overlooked Yet Powerful Indicators
Volume Profile and On-Balance Volume (OBV) track market activity through trading volume. While not always listed among the classic momentum indicators, they can be helpful tools to confirm whether price swings are accompanied by strong or weak participation from traders.
Volume Profile
- What It Is: A histogram plotted on the vertical axis of your price chart, showing how much volume traded at various price ranges.
- How It Helps: Large volume nodes often align with support and resistance levels. Volume Profile can give insights into market conditions that purely price-based indicators might miss.
On-Balance Volume (OBV)
- Calculation: OBV adds volume on up days and subtracts volume on down days, giving a running total.
- Why It’s Useful: If price is rising but OBV is flat or declining, it may signal a lack of momentum behind the current price movements. If the price is flat but OBV is climbing, it could hint at accumulation and a future breakout.
Integrating Volume Indicators with Options
- Confirm Breakouts: If Bollinger Bands squeeze and you see a volume spike, your trading plan could incorporate a breakout strategy—perhaps a straddle or strangle if you expect a big move in market price.
- Set Reliable Stop-Loss Levels: High-volume zones often indicate strong support and resistance. Placing your stop just beyond these zones can be part of a robust fund protection plan.
- Avoid Conflicting Signals: If an indicator like RSI suggests a bullish crossover but OBV is flat, you might wait for volume confirmation before entering a position.
Conclusion
Mastering the Best technical indicators for options trading is essential for making informed decisions in the often volatile options market. Each of the eight indicators we’ve discussed Bollinger Bands, RSI, the Stochastic Oscillator, the Put-Call Ratio, Moving Averages, MACD, Support and Resistance, and Volume Profile/OBV sheds light on different aspects of price action, market sentiment, and future price movements. By understanding their strengths and limitations, and using them in synergy, you can develop an option trading strategy that adapts to various market conditions from bullish breakouts to bearish sentiment and sideways churn.
Keep in mind that no single indicator guarantees a profitable trade. Always cross-reference multiple technical analysis tools to reduce the risk of false signals, and make sure your approach fits your trading style, investment objectives, and risk tolerance. Options trading can be incredibly powerful, but it also comes with significant risk, particularly if market volatility increases sharply or if you hold option positions close to expiration. Continuous learning, practice with paper trading, and careful planning will help you harness the Best technical indicators for options trading more effectively and ultimately guide you toward informed trades over the long run.