Table of Content
How to Trade the Trend Following Strategy for Consistent Gains
By Vincent NguyenUpdated 400 days ago

Getting Started with the Trend Following Strategy
The Trend Following Strategy aligns your trades with market momentum, capturing long-term price movements instead of betting on reversals. This enduring trading approach is used by professional and beginner traders alike for its simplicity and focus on strong trends.
By identifying consistent price directions that break from historical averages, trend followers aim to stay on the profitable side of market movements. Unlike reversion strategies, which depend on prices snapping back to averages, this method lets you ride trends while managing risk.
In this guide, we’ll explore key concepts, tools like Bollinger Bands, and backtesting techniques to refine your strategy. You’ll also discover actionable examples to help you trade confidently across different market conditions.
Understanding the Trend Following Strategy
Trend following ranks among the most common strategies used by short-term traders, swing traders, and even day traders. Its core principle is to ignore small fluctuations in price over time and, instead, focus on the prevailing trend. When the stock price or forex pairs begin to move consistently upward or downward, that strong trend can create clear trading opportunities.
Key Characteristics of Trend Following
1. Momentum Matters: Trend followers believe that once a price series starts moving in one direction, it tends to keep going. Momentum trading principles often apply here, because traders look for confirmation that the current price is moving strongly away from historical averages.
2. Reduced Noise: Trend followers attempt to filter out short-term price fluctuations. They aim to capture significant moves without being distracted by the random ups and downs found in any trading day.
3. Focus on Medium-to-Long Time Horizons: Unlike a reversion strategy, trend following does not expect prices to return to a level over time. Instead, it rides the wave of a significant breakout or breakdown until that wave ends. This long-term average approach can be applied to various financial instruments, including stocks, forex trading pairs, and even options market strategies.
Why Trend Following Instead of Reversion?
- Simplicity: A reversion in trading setup relies on pinpointing oversold conditions or overbought condition levels, then betting on a bounce back to average levels. Trend following, by contrast, requires identifying a clear breakout and letting the move play out.
- Fewer Decisions: Reversion traders often buy and sell frequently because they expect quick profit from short-term mean reversals. In contrast, trend followers open a single position and hold it longer, which sometimes translates to lower stress and fewer exit rules.
- Capturing Big Moves: One massive trend can overshadow several small losses. That’s the fundamental benefit of letting your winners run.
Real-World Application
Many hedge funds, Algorithmic trading strategies, and even retail traders rely on the Trend Following Strategy. They may combine it with sophisticated statistical analysis, such as the Augmented Dickey-Fuller test for stationarity or regression channels for forecasting. However, you can still apply basic techniques without diving into complex instruments or advanced financial theory. The success of a Trend Following Strategy often comes down to consistent execution, a solid risk management plan, and the disciplined monitoring of market environments.
Key Concepts and Tools for the Trend Following Strategy
A trader should understand several fundamental concepts before employing any Trend Following Strategy. These key concepts include position size, Technical Indicators, and risk management. Once you grasp these ideas, you can create potential trading opportunities by looking for asset moves that align with your overall plan.
Technical Indicators
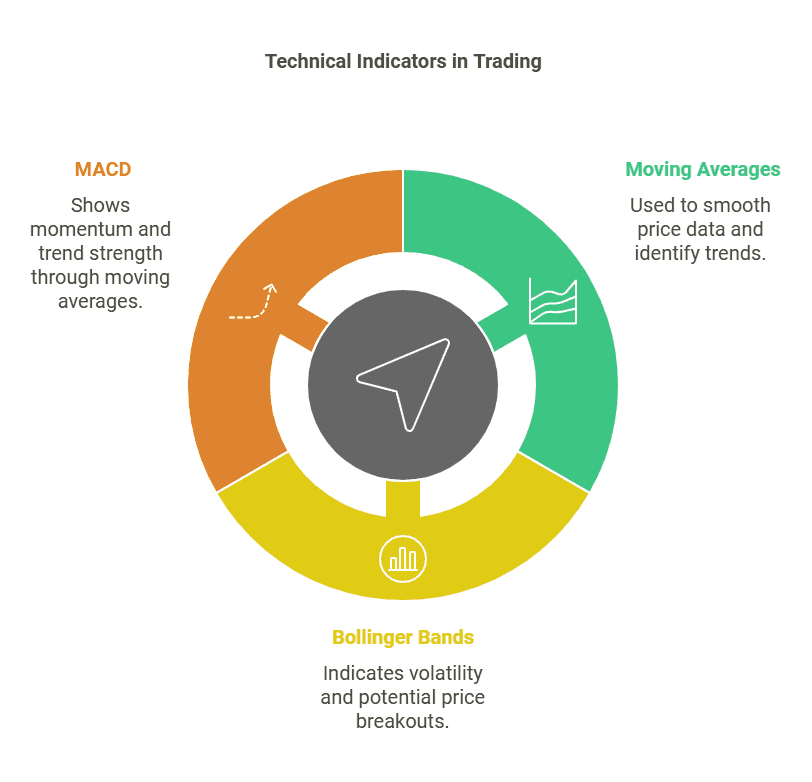
1. Moving Averages
- Simple Moving Average (SMA) and Exponential Moving Average (EMA) smooth out random price deviations.
- Traders often look for crosses (e.g., 50-day SMA crossing above the 200-day SMA) to confirm a potential entry.
2. Bollinger Bands
- Bollinger Bands use standard deviations to plot upper and lower bands around a middle band (usually a moving average).
- When price breaks above the upper band with strong momentum, it can signal an emerging trend. When price falls below the lower band, it may indicate a downward trend.
3. Average Convergence Divergence (MACD)
- Often referred to as MACD, this momentum indicator helps confirm a trend’s strength by comparing multiple moving averages.
- Positive MACD crossovers can act as trading signals in a bullish trend, while negative crossovers may reveal a bearish shift.

Market Conditions and Trend Durations
- Volatile vs. Range-Bound Markets: Trend following thrives when prices move decisively. If the market is stuck in range-bound markets with minimal asset moves, then reversion tendencies might dominate.
- Multiple Asset Classes: You can apply trend following to stock market securities, forex pairs, and commodities futures trading. The primary condition is that the price must display directional persistence over a chosen timeframe.
- Seasonality and Historical Returns: Some markets trend more reliably during specific times. Researching historical returns can reveal repeating patterns.
Risk Management Essentials
- Stop-Loss Orders: Placing a stop-loss below a recent support level or using a volatility-based calculation helps limit risk.
- Position Size: Small position sizes can lower stress. This approach is especially helpful for beginners who aren’t sure of market movements.
- Trailing Stops: Trend followers often adjust their stop-losses as the price moves in their favor. This captures gains while giving the market room to breathe.
Combining Tools for Stronger Signals
Using multiple indicators can reduce false signals. For instance, wait for a moving average crossover, then confirm momentum with MACD. Finally, check whether Bollinger Bands are expanding, indicating higher volatility and possible continuation of the trend. This cross-verification helps you avoid bad trades and focus on genuine trend opportunities.
BT-Bollinger Bands - Trend Following
The "BT-Bollinger Bands - Trend Following" strategy uses Bollinger Bands to signal trend initiation, setting entries when price action breaches and closes across band extremes—long on closing above the upper band, short on closing below the lower band. Exits are executed when price reverts to the band's mean. For enhanced precision, integrate a moving average as an additional filter or automate entries and exits with compatible bot services.
BT-Bollinger Bands - Trend Following
Kohl's Corporation (KSS)
@ 5 min
1.25
Risk Reward62.83 %
Total ROI344
Total TradesStep-by-Step Guide to Implementing the Trend Following Strategy
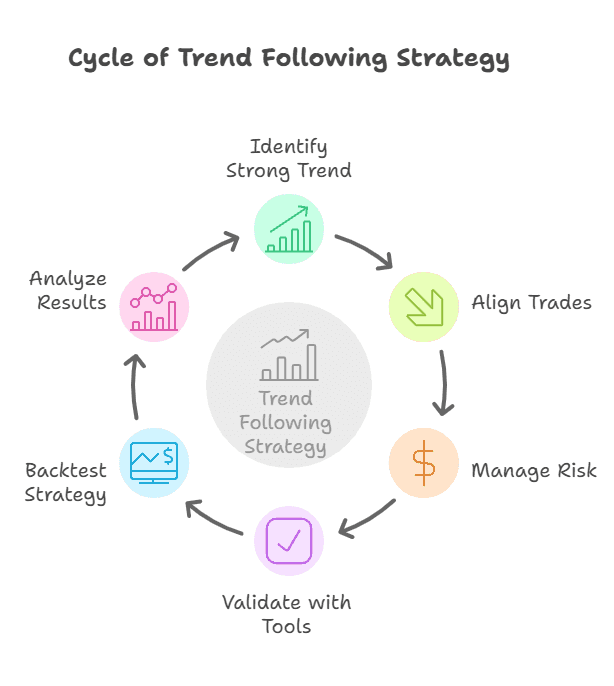
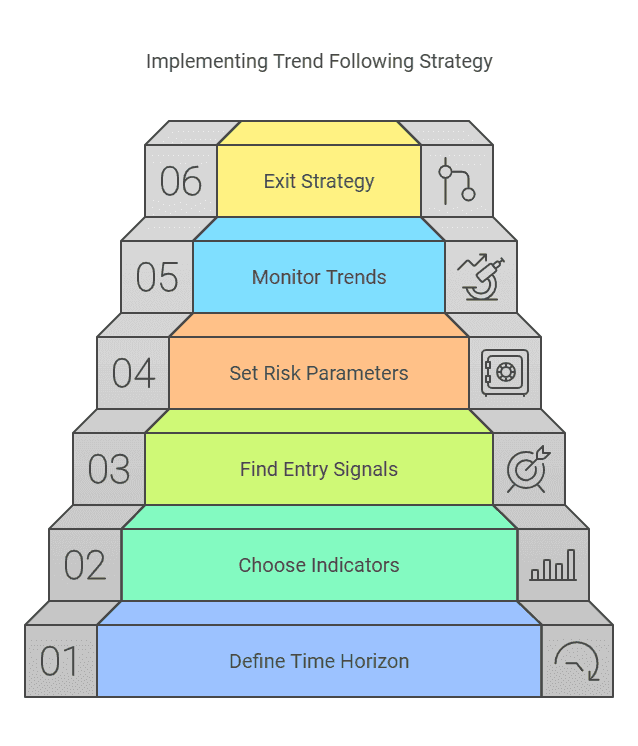
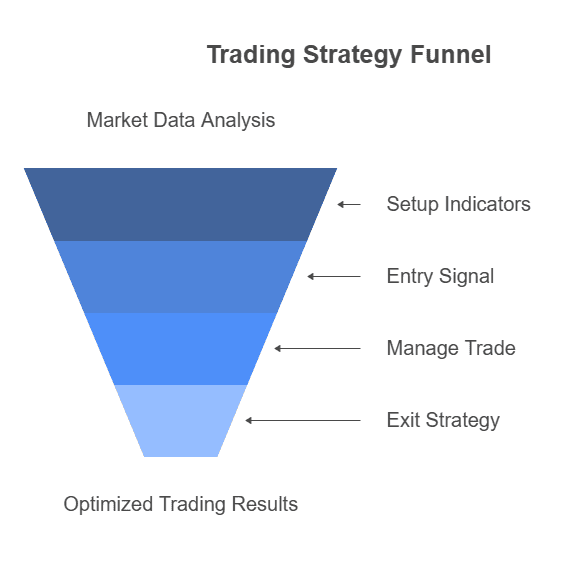
When you decide to trade using the Trend Following Strategy, you focus on identifying a strong trend, entering at a favorable point, and then riding the move until momentum fades. Below is a simple, step-by-step approach to help you get started. This plan works across various asset classes, including stocks, forex pairs, and other financial instruments.
Define Your Time Horizon
First, determine how long you plan to hold a trade. Some traders adopt a short-term approach, exiting positions within a few trading days. Others prefer a longer time horizon, stretching from several weeks to months.
- Consider your risk tolerance and lifestyle before choosing a style of trading. Short-term traders may encounter more frequent trades, while long-term practitioners might open fewer positions but aim for bigger gains.
Choose Technical Indicators
Most trend followers rely on a combination of technical analysis tools. Moving Averages, Bollinger Bands, and the MACD indicator (average convergence divergence) can help confirm when a trend begins or ends.
- Observe whether asset prices are moving away from historical averages. This price deviation can signal the start of a fresh trend.
- A good rule of thumb is to pick two or three key indicators that fit your strategy, then learn them thoroughly.
Find Potential Entry Signals
Look for breakouts above resistance level zones, where buyers overwhelm sellers and push the current price higher. You can also watch for closes above a key Simple Moving Average to confirm momentum.
- Validate your entry by checking the direction of market movements. A consistent series of higher highs and higher lows often indicates an uptrend.
- In a downtrend, watch for lower highs and lower lows. This suggests selling pressure is dominant.
Set Risk Management Parameters
Always decide on position size and stop-loss placement before entering a trade. For example, you could set a stop-loss one or two standard deviations below your entry if you’re going long.
- Avoid risking too much capital on a single position. Many professional traders risk only 1–2% of their account per trade.
Monitor the Trend and Adjust Stops
If your trade moves in your favor, consider using a trailing stop. This method automatically adjusts the stop level to lock in profits while letting the trade run.
- Review market conditions periodically. If volatility spikes or news events drastically change asset moves, reassess your exit rules to protect profits or minimize losses.
Exit Strategy
Exit when your predefined stop-loss is triggered or if you notice a clear reversal pattern. Holding on too long can erode profits if the trend fizzles out.
- Some traders also exit when price returns to the moving average or if the MACD shows a sharp negative divergence.
This process helps you capture potential trading opportunities and reduces emotional decision-making. By combining consistent rules with disciplined execution, you can trade the Trend Following Strategy in a structured manner.

Yesterday’s High Breakout - Trend Following Strategy
The "Yesterday's High Breakout - Trend Following Strategy" capitalizes on trend momentum by entering long positions at the break of the previous day's high. It incorporates diverse exit methodologies, including fixed Take-Profit and Stop-Loss, a trailing-stop with adjustable offset, or exiting if the price closes under a certain EMA. Filters based on pair volatility and a gap above yesterday's high minimize false breakouts, tailored to cryptos like NULS with specific percentage parameters for optimal trade execution.
Yesterday’s High Breakout - Trend Following Strategy
FTX Token (FTTUSD)
@ Daily
2.73
Risk Reward265,888.43 %
Total ROI440
Total TradesBacktesting the Trend Following Strategy – 3 Real-World Examples
Backtesting allows you to validate how a Trend Following Strategy might have performed under historical market conditions. By simulating trades over actual trading history, you can see if a particular method fits your risk tolerance and overall investment objectives. Below are three straightforward backtest examples to illustrate different ways of capturing trend-based trading opportunities.
Backtest #1: Simple Moving Average Crossover
Moving Average Crossover Strategy
The Moving Average Crossover Strategy employs a combination of two simple moving averages and one exponential moving average to signal entry and exit points. Traders can customize which moving average crossings to use, with options to filter trades by conditions such as volume or RSI. Starting with a $100,000 account, it allocates 10% per trade to capitalize on these crossover signals.
Moving Average Crossover Strategy
QuantumScape Corporation (QS)
@ 5 min
1.00
Risk Reward1.49 %
Total ROI1329
Total TradesMoving Average Crossover Strategy
Globe Life Inc. (GL)
@ 15 min
1.32
Risk Reward131.37 %
Total ROI1280
Total Trades1. Setup: Use two key moving averages, such as the 50-day and 200-day SMA. 2. Entry Rule: Go long when the 50-day SMA crosses above the 200-day SMA, indicating potential upward momentum. Conversely, go short when the 50-day drops below the 200-day. 3. Stop-Loss: Place an initial stop-loss one to two standard deviations below the entry price for long trades. This volatility-based approach helps protect against sudden reversals. 4. Exit Rule: Close the position when the short-term SMA moves back in the opposite direction. You could also exit if Bollinger Bands begin narrowing, suggesting reduced volatility and the end of a trending phase.
Results and Observations
- This simple crossover often identifies strong trend periods but may lag when price moves sideways.
- Although you might suffer small losses during whipsaws, large trends can produce sizable gains if you let winners run.
- Historical returns from this approach can be further refined by filtering out range-bound markets or combining momentum indicators.
Backtest #2: Donchian Channel Breakout
1. Setup: Apply a Donchian Channel that tracks the highest high and lowest low over a chosen period (e.g., 20 days). 2. Entry Rule: Go long when the asset price breaks above the upper Donchian Channel. This breakout hints that bullish momentum could drive further price moves. 3. Stop-Loss: Place a trailing stop around the lower channel band or use the channel midpoint to gradually lock in gains as the trend progresses. 4. Exit Rule: Exit if the price falls below the midpoint or returns inside the channel for a specific number of bars.
Results and Observations
- Donchian Channel breakouts capture extreme price moves early. However, they may also trigger false signals in quiet market environments.
- Successful trades in trending phases can yield impressive gains. On the flip side, you need patience during short-term fluctuations.
Backtest #3: Combining RSI with a Moving Average Filter
1. Setup: Use a 14-period Relative Strength Index (RSI) alongside a 50-day SMA.
2. Entry Rule: Buy when RSI crosses above 50 (indicating momentum shifting bullish) while the price is trading above the 50-day SMA. This dual condition confirms both trend direction and improving price movement.
3. Stop-Loss: Set your stop-loss below a recent support area or pivot low, adjusting it as the trade moves in your favor.
4. Exit Rule: Exit if RSI drops below 50 again, or if the price closes under the 50-day SMA.
Results and Observations
- This strategy uses RSI to weed out weaker setups. Since RSI helps gauge oversold conditions and overbought condition levels, it can keep you aligned with the overall trend.
- Historically, combining momentum filters with a moving average may reduce false entries compared to a single indicator alone.

Key Takeaway
Backtesting these examples demonstrates how different trading signals and technical indicators can be combined. Whether you rely on moving averages, Donchian breakouts, or RSI-based filters, the Trend Following Strategy often hinges on one principle: letting winners ride while cutting losers quickly. This philosophy aims to maximize gains in strong trend phases and keep losses small when the market changes direction.
Common Pitfalls When Trading the Trend Following Strategy
Even a solid Trend Following Strategy can encounter challenges. Inconsistent execution, emotional decisions, and ignoring shifts in market environments can all erode potential profit. Avoid these pitfalls to maintain a disciplined approach.
1. Entering Too Early or Too Late
Issue: Traders often jump in at the slightest sign of a price increase or hold off until the move is nearly over. Both scenarios can lead to suboptimal entries.
- Solution: Wait for clear signals from your chosen technical analysis tool. Confirm higher highs and higher lows (in an uptrend) or lower highs and lower lows (in a downtrend).
2. Overlooking Risk Management
Issue: Neglecting stop-loss orders or using an oversized position can wreak havoc on your account if a trade reverses sharply.
- Solution: Size your trades based on your risk tolerance, and always have an exit signal in place. Consistent position sizing guards against catastrophic losses.
3. Failing to Adapt to Market Movements
Issue: A method that works during trending phases may fail when markets become range-bound. Reversion opportunities might appear if price stalls, yet a trend follower could sit idle or rack up false signals.
- Solution: Review your strategy’s performance under different market conditions. If the trend weakens, either tighten your stops or step aside until momentum returns.
4. Ignoring Fundamental Concepts
Issue: Focusing only on price charts can sometimes blind you to events that fundamentally shift asset prices. For instance, economic news or sudden policy changes might disrupt even the strongest trends.
- Solution: While trend following is primarily technical, staying aware of key fundamentals can help you avoid trading against major shifts in financial markets
5. Emotional Decision-Making
Issue: Traders who panic when price retraces might exit early and miss the bigger move. Fear and greed can also tempt them to overstay a trend or add more to a losing position.
- Solution: Develop a rule-based plan. When you know exactly why you’re entering and exiting, you’ll be less likely to trade on emotion.
Conclusion
Trend following offers a structured approach to trade in sync with major price swings. By focusing on identifying clear market momentum, setting robust stop-losses, and sticking to defined entry and exit criteria, you can reduce emotional biases and stay disciplined. This strategy encourages patience, as even minor dips can be part of a broader trend that yields sizable gains over the long run. While no approach is foolproof, combining reliable technical indicators with sound risk management can help you ride profitable trends more confidently. The Trend Following Strategy can become your ally in capturing extended price moves successfully.
Moreover, you can also explore the TradeSearcher to backtest your Trend Following Strategy and discover high-probability setups for consistent gains.
About the Trend Following Strategy
Yes. While trend following typically implies longer holding periods, some traders adapt it for day trading by using shorter timeframes (e.g., 5- or 15-minute charts). The core principle remains: look for a clear directional bias, enter when momentum confirms, and exit if the trend weakens.
Not necessarily. Many free charting platforms offer moving averages, Bollinger Bands, and other core indicators. Paid tools can enhance analysis, but simple setups often suffice for spotting and riding trends successfully.
Yes. Some traders blend fundamental concepts (like earnings reports or economic indicators) with technical trend signals. This dual approach helps confirm whether a trend is supported by both price action and solid fundamentals.
In range-bound conditions, trend followers often wait for breakouts before entering a trade. Using a filter, like a moving average crossover or Donchian Channel signal, can help reduce false starts in choppy markets.
It depends on your rules. Some traders wait for a pullback to a moving average or a short retracement for a safer entry. Others accept the missed portion of a move and still join if indicators confirm continued trend strength.


