Table of Content
7 Best Swing Trading Strategies With 6 Backtest Examples for Profitable Trades
By Vincent Nguyen
Updated 507 days ago
Best Swing Trading Strategies
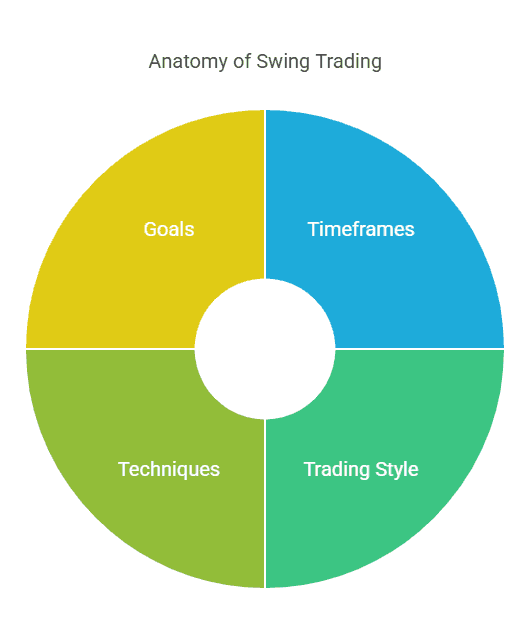
Swing trading is a style of trading that aims to capture short- to medium-term gains in a stock (or any tradable asset) over a period of days to several weeks. Rather than obsessing over every one-minute candle, swing traders typically look at higher timeframes—like the 4-hour, daily, or even weekly charts—and try to capitalize on significant price movements or “swings.”
In other words, swing traders aren’t in-and-out on the same day (that’s day trading), but neither are they sticking around for the long haul as a position trader might. They try to ride trends in a measured way, often employing various technical indicators and chart patterns to time entries and exits.
In this article, we’ll explore seven of the best swing trading strategies, then we’ll walk through six backtest examples. By the end, you should have a clearer understanding of how to approach swing trading, how these strategies work, and how you might assess their performance using backtesting tools (like TradeSearcher or any other robust backtesting platform).
Let’s get started.
Why Swing Trading?
- Less Stressful than Day Trading: Watching every tick in the market can be stressful and time-consuming. Swing trading allows you to make informed decisions without glued-to-the-screen mania.
- Potentially Bigger Profits per Trade: If day trading aims to skim small gains multiple times a day, swing trading might aim to capture larger chunk moves—although you’ll typically have fewer trades.
- Flexibility: Because trades can last from a few days to a few weeks, swing traders have time to react to news, chart developments, and fundamental shifts without feeling frantic.
- Applicability to Many Markets: Swing trading strategies can work on stocks, cryptocurrencies, forex pairs, commodities—just about anything that moves and can be charted.
Who Is This For?
- Part-Time Traders: If you have a day job or simply don’t want to watch the markets every second, swing trading offers a good balance.
- Anyone Wanting a Middle Ground: If buy-and-hold is too slow and day trading is too fast, swing trading might be just right.
Strategy 1: Trend-Following Swing Trading
One of the oldest trading mantras out there is “The trend is your friend until it ends.” Trend-following is all about identifying a prevailing trend (uptrend or downtrend) and riding the wave.
Key Components
1. Identifying the Trend
A quick way to spot a trend is by looking at the slope of a major moving average (like the 50-day or 100-day) or using trendlines. If the price consistently makes higher highs and higher lows, that’s an uptrend. For a downtrend, it’s lower highs and lower lows.
2. Entry Signals
- Moving Average Crossover: A shorter-term moving average crossing above a longer-term one is a common entry signal.
- Price Pullback to Trendline: Some traders wait for a price pullback (dip in an uptrend or rally in a downtrend) to a trendline or a moving average before entering.
3. Stop-Loss & Risk Management
- Below Swing Low in Uptrend: If you’re buying in an uptrend, you might place your stop below the most recent swing low.
- ATR (Average True Range): Some traders use a multiple of the ATR to define a volatility-based stop.
4. Exit Strategy
- Trailing Stop: You might trail your stop using a short moving average or an ATR-based channel.
- Opposite Signal: You might exit if price crosses below a key moving average or if you get a bearish crossover signal.
Let’s say you’re looking at a stock in a clear uptrend. The price is above the 200-day moving average (MA). Then, the 50-day MA crosses above the 100-day MA—an indication that momentum is building. You enter a long position. You set your stop-loss below the last swing low or 2x ATR away—whichever suits your risk tolerance. If the price keeps rising, you keep your trade open, maybe adjusting your stop-loss upward as the stock makes higher highs. The idea is to capture the meat of the move while avoiding being shaken out by minor fluctuations.
3 profitable backtest examples of a Trend-Following Swing Trading strategy
Employ a systematic swing trading approach that capitalizes on market trends and mitigates downturn risks. Utilize five key indicators: a 200-period EMA, ATR Stop Loss, Squeeze Momentum, MACD, and RSI. Engage with three distinct entry points based on the market's position relative to the 200 EMA and momentum shifts. Manage risks effectively by calculating position sizes to risk a fixed percentage of your capital, attuned with an ATR-based stop loss.
Investments/swing trading strategy for different assets
ENA / TetherUS (ENAUSDT)
@ 4 h
1.26
Risk Reward22.40 %
Total ROI66
Total TradesRSI Average Swing Bot
Cronos/Tether (CROUSDT)
@ Daily
1.94
Risk Reward1,875.58 %
Total ROI77
Total TradesStrategy 2: Breakout Swing Trading
Breakout trading focuses on those moments when price breaks above a key resistance level or below a key support level. The logic: once price busts through a level it has historically struggled with, there might be enough momentum to carry it into a new range.
Key Components
1. Identify Key Levels
You look for well-defined support and resistance areas on the chart. This could be prior swing highs and lows or pivot points visible over several weeks.
2. Wait for the Break
- High Volume Breakout: Many breakout traders prefer to see higher-than-average volume to confirm that the move has conviction.
- Close Above/Below: Some traders wait for a candle close above/below the level rather than a simple intraday breach.
3. Entry Timing
- Immediate Entry: The moment the breakout is confirmed, you enter.
- Retest Entry: Others wait for a retest of the broken level to confirm the breakout is legitimate (i.e., old resistance turns into new support).
4. Stop-Loss Placement
Typically goes just below the breakout line (for a bullish trade) or just above (for a bearish trade).
5. Profit Targets
- Measure the Range: One method is measuring the depth of the prior consolidation or range, then projecting that from the breakout point.
- Fibonacci Extensions: Some traders also use Fibonacci levels to forecast potential targets.
Imagine a stock moving sideways between $50 (support) and $55 (resistance) for a couple of weeks. Suddenly, it bursts above $55 on a strong volume day—maybe some positive earnings news. A breakout trader hops in right after the close above $55. They set a stop-loss around $54, just under the old resistance. If the momentum continues, the stock might run to $60, $65, or beyond.
3 profitable backtest examples of a breakout swing trading strategy
The Uptrend and Oversold Index Swing Trading System 8H leverages 20 EMA and SMA indicators to generate scores signaling strong trends. A high score indicates an uptrend, while a low score identifies potential reversals. Customize your experience with modes like Oversold and Overbought, leverage adjustments, trailing stop-losses, and risk capital settings. Optimized for 8H timeframes, this system enhances market strategies by analyzing past performance to optimize future trades.
Bollinger Band Breakout
Tesla, Inc. (TSLA)
@ 2 h
1.52
Risk Reward2,182.49 %
Total ROI119
Total TradesDonchian Breakout Strategy
Walt Disney Company (The) (DIS)
@ 2 h
1.49
Risk Reward131.39 %
Total ROI147
Total TradesStrategy 3: Mean Reversion Swing Trading
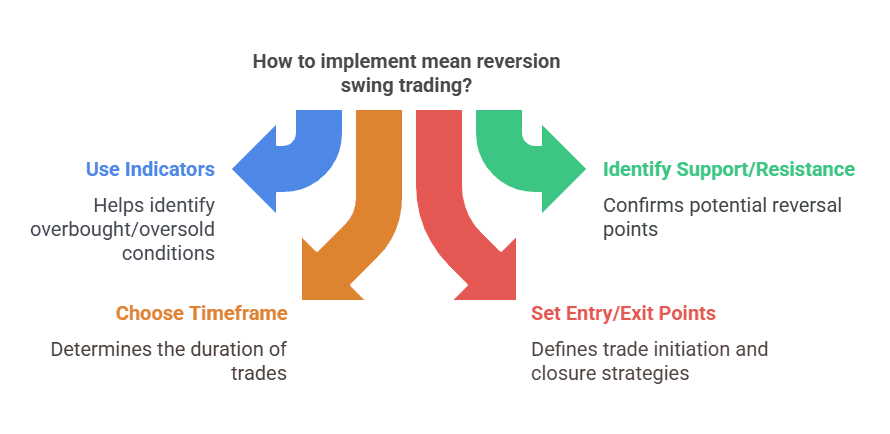
Ever notice how markets can sometimes get “overextended” in one direction, only to bounce back toward the average price? That’s the premise behind mean reversion. In simpler terms, if a price gets too far away from its usual range, it could snap back like a rubber band.
Key Components
1. Overbought and Oversold Indicators
- Relative Strength Index (RSI): RSI above 70 is traditionally considered overbought, and below 30 is oversold.
- Stochastic Oscillator: Similar approach; above 80 overbought, below 20 oversold.
2. Support and Resistance
Even though you’re betting on a price “snap back,” you still want to confirm that there’s a credible support or resistance level that might cause a bounce.
3. Timeframe Matters
Because we’re swing trading, we may look at daily or 4-hour charts. An RSI in overbought territory on a daily chart may stay there for weeks if the trend is extremely strong, so be cautious.
4. Entry & Exit
- Entry: Wait for the indicator to come out of the overbought/oversold region. For instance, if RSI crosses back below 70 from above, that could be a sell signal (or a short entry signal).
- Stop-Loss: Above recent highs if you’re shorting, below recent lows if you’re going long.
- Profit Target: Often back around the “mean” level, such as the 20-day or 50-day moving average, or another indicator.
Suppose a forex pair has an RSI reading of 85 on the daily chart—very high. You watch for a sign that momentum is waning. A couple of days later, the RSI dips back down to 75. You might initiate a short position, believing price will revert back to its 50-day moving average. You place a stop a bit above the recent high in case momentum picks up again. If the price indeed retraces, you’ll exit near the 50-day MA or a well-defined support zone.
Strategy 4: Pullback (Retracement) Trading
Pullback trading is somewhat related to trend-following, but more specifically focuses on waiting for that temporary pause or dip in an uptrend (or a small rally in a downtrend) to get a better entry price.
Key Components
1. Primary Trend Identification
Ensure the market is in a strong, established trend. For an uptrend, you typically see rising moving averages, higher highs, and higher lows.
2. Wait for a Pullback
- Moving Average Support: Some traders look for the price to dip down to a rising 50-day or 20-day MA.
- Fibonacci Retracements: Others use Fibonacci levels (like 38.2%, 50%, or 61.8%) to identify possible bounce areas.
3. Confirming the Bounce
A key part of pullback trading is waiting for some sign that the pullback is over and the trend is resuming. This could be a bullish candlestick pattern (hammer, engulfing candle, etc.) or a momentum indicator turning upward.
4. Stop-Loss & Target
- Stop-Loss: Often placed below the swing low in an uptrend or above the swing high in a downtrend.
- Target: Could be a recent swing high or an extension of the move using Fibonacci levels.
You spot a strong uptrend in a tech stock that’s soared from $100 to $140. Now it dips to $130. You draw a Fibonacci retracement from $100 to $140 and see that $130 is near the 38.2% retracement. You watch for a bullish candlestick pattern on the daily chart. As soon as you see a hammer candle with a long lower wick, you decide to enter. You place a stop-loss below $128 (the candle’s low) and aim for the recent high of $140 as your first target.
6 Backtest Examples
Now that we’ve outlined four swing trading strategies, let’s walk through six hypothetical backtest scenarios. We’ll use a mix of strategies, referencing “Tradesearcher” (or any robust backtesting platform) to see how these strategies might have performed. Assume these are all purely illustrative, fictional examples meant to show how you’d approach a backtest and interpret results.
Disclaimer: All numbers are hypothetical and for illustrative purposes only. This does not constitute financial advice. Always do your own due diligence.
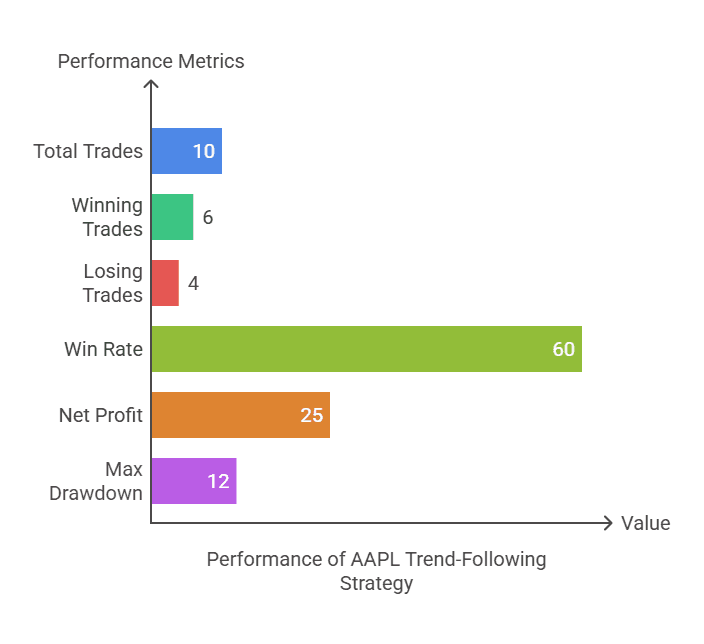
1. Trend-Following with 50-Day Moving Average (MA)
- Asset: Apple (AAPL)
- Timeframe: Daily
- Backtest Period: 2 years
Criteria
- Buy when price closes above its 50-day MA for 3 consecutive days.
- Sell when price closes below its 50-day MA for 2 consecutive days (to filter out quick dips).
Results Summary
- Total Trades: 10
- Winning Trades: 6
- Losing Trades: 4
- Win Rate: 60%
- Net Profit: +25% (cumulative) over 2 years
- Max Drawdown: ~12%
Interpretation
- While a 60% win rate may not seem high, the average winner was larger than the average loser, yielding a decent total profit.
- The strategy may have missed some short-term pullbacks but effectively stayed in major uptrends.
- Drawdown of 12% might be acceptable depending on your risk tolerance, but it also suggests the possibility of improved exits or a stop-loss strategy to reduce drawdowns.
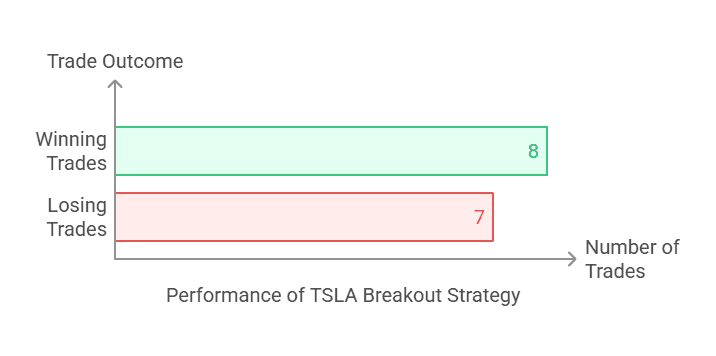
2. Breakout Strategy with Volume Filter
Asset: Tesla (TSLA)
Timeframe: 4-hour
Backtest Period: 1 year
Criteria
- Identify the previous 20-bar (4-hour candles) high as resistance.
- Buy if price breaks and closes above that high with volume 30% above its 20-bar volume average.
- Stop-Loss: 2% below breakout level.
- Exit: Next close below the 20-bar moving average.
Results Summary
- Total Trades: 15
- Winning Trades: 8
- Losing Trades: 7
- Win Rate: 53%
- Net Profit: +40% (cumulative)
- Max Drawdown: 20%
Interpretation
- Although the win rate is near 50%, the strategy banked a healthy profit because breakout winners tended to run far, especially in a volatile stock like Tesla.
- The 2% stop-loss might be tight for TSLA’s volatility, contributing to a moderate success rate. Some might consider loosening it.
- The volume filter helped avoid many false breakouts, but not all.
3. Mean Reversion Using RSI on a Crypto Pair
Asset: Bitcoin (BTC/USD) Timeframe: Daily Backtest Period: 2 years
Criteria
- Buy if RSI(14) crosses back above 30 (oversold).
- Sell if RSI crosses back below 70 or if price hits a 10% gain from entry (whichever happens first).
Results Summary
- Total Trades: 22
- Winning Trades: 14
- Losing Trades: 8
- Win Rate: ~63%
- Net Profit: +65% (cumulative)
- Max Drawdown: 25%
Interpretation
- Crypto markets are known for strong trending moves, but they also can get extremely overbought/oversold.
- The 63% win rate is decent, and the 10% profit target helped lock in gains quickly.
- However, the 25% max drawdown is quite high, reflecting crypto’s volatility. Adjusting your position size could mitigate overall risk to your portfolio.
4. Pullback Strategy with Fibonacci Retracement on Forex
Asset: EUR/USD
Timeframe: Daily
Backtest Period: 3 years
Criteria
- Identify a well-established uptrend using the 200-day MA. Only take long trades when the price is above the 200-day MA.
- Wait for a pullback to the 50% Fibonacci retracement level drawn from the last major swing low to swing high.
- Enter on a bullish candlestick pattern at or near the 50% level.
- Stop-Loss: 1 ATR below the candlestick low.
- Target: Retest of the previous swing high.
Results Summary
- Total Trades: 18
- Winning Trades: 11
- Losing Trades: 7
- Win Rate: ~61%
- Net Profit: +18% (cumulative in pips)
- Max Drawdown: ~10%
Interpretation
- The 61% win rate is acceptable, and the strategy achieved consistent returns.
- Some trades missed if the price didn’t quite retrace to the 50% level, meaning fewer trades but higher conviction.
- A 10% drawdown might be decent, but one can experiment with partial profits at the 38.2% level to optimize further.
5. Support & Resistance Range Strategy on a Commodity
Asset: Gold (XAU/USD)
Timeframe: 4-hour
Backtest Period: 1.5 years
Criteria
- Identify a horizontal range of about $1,700 (support) to $1,800 (resistance) that has held for several weeks.
- Buy if price is within 0.5% of $1,700 and the RSI(14) is below 40.
- Short if price is within 0.5% of $1,800 and RSI(14) is above 60.
- Stop-Loss: $10 beyond the boundary.
- Take Profit: Mid-range for partial exit, opposite boundary for final exit.
Results Summary
- Total Trades: 12
- Winning Trades: 9
- Losing Trades: 3
- Win Rate: 75%
- Net Profit: +15%
- Max Drawdown: 8%
Interpretation
The high win rate reflects a stable range that didn’t see major breakouts. Range-bound conditions allowed for repeated profitable trades.
The net profit is moderate. Because each swing is relatively small, you’re collecting smaller but more frequent wins.
If gold had broken out strongly, the stop-loss placements would have helped limit losses.
6. Moving Average Crossover on Tech Stocks Basket
Asset: Basket of 5 Tech Stocks (e.g., Apple, Microsoft, Amazon, Google, and Meta) Timeframe: Daily Backtest Period: 2 years
Criteria
- Bullish Entry: 20-day MA crossing above 50-day MA on any of the 5 stocks.
- Bearish Exit: 20-day MA crossing back below the 50-day MA.
- Stop-Loss: 5% below the crossover point or last swing low, whichever is lower.
- Additional Rule: Only hold a max of 3 positions at a time to manage correlation risk.
Results Summary
- Total Trades: 20 across all stocks
- Winning Trades: 10
- Losing Trades: 10
- Win Rate: 50%
- Net Profit: +30% (cumulative, factoring in all trades)
- Max Drawdown: 15%
Interpretation
- While the win rate is just 50%, the winners (in trending phases) were bigger.
- Diversifying across multiple tech stocks may reduce single-stock risk but can expose you to sector risk if all are correlated. The rule about holding only 3 positions helped.
- A 15% drawdown is somewhat acceptable, but you could tweak the moving averages or incorporate a volume filter for better entries.
Conclusion
Swing trading sits comfortably between day trading’s fast pace and buy-and-hold’s slower approach. With the right strategies—and discipline to follow them—you can capture meaningful moves in the market without the headache of intra-day stress.
Here’s a quick recap of the strategies we covered:
- Trend-Following: Ride the wave of an existing trend.
- Breakout: Jump on board when price breaks a key level on strong volume.
- Mean Reversion: Fade overbought/oversold conditions anticipating a snap back to the mean.
- Pullback (Retracement): Enter on dips or rallies in a broader trend, looking for continuation.
- Support & Resistance Range: Buy near support, sell near resistance in sideways markets.
- Momentum: Harness strong moves fueled by volume and volatility.
- Moving Average Crossover: Use a pair of MAs to spot trend shifts, both bullish and bearish.
Then we reviewed six hypothetical backtest examples, showing how each approach might look “under the hood.” The main takeaways:
- No single strategy works perfectly in all markets.
- Risk management is key to longevity as a trader.
- Backtesting helps refine entries, exits, and overall strategy parameters.
- Adaptation is crucial; stay flexible as market conditions change.
Ultimately, the best strategy is the one that aligns with your risk tolerance, your time horizon, and your psychological comfort. Whether you prefer methodical moving average crossovers or quick-hitting breakout plays, swing trading can be a highly rewarding venture once you find the groove that suits your style.
Final Note
If you’re serious about fine-tuning any of these strategies, consider leveraging a robust backtesting platform like TradeSearcher. Backtesting is how you’ll transform an interesting idea into a data-backed plan. With real-world historical data and the ability to test multiple variables, you can see the hypothetical performance of these swing trading strategies—and adapt accordingly. Remember, though, that no matter how good your system looks historically, real trading always involves a dose of uncertainty. Manage your risks, stay humble, and keep learning!
Find the best trading strategies
Rely on data, not emotion. TradeSearcher helps you find the best trading and TradingView strategies, easily, and to learn from them using AI.