Table of Content
8 Best Technical Indicators for Day Trading | Day Trading Guide
By Vincent NguyenUpdated 392 days ago
Best technical indicators for day trading
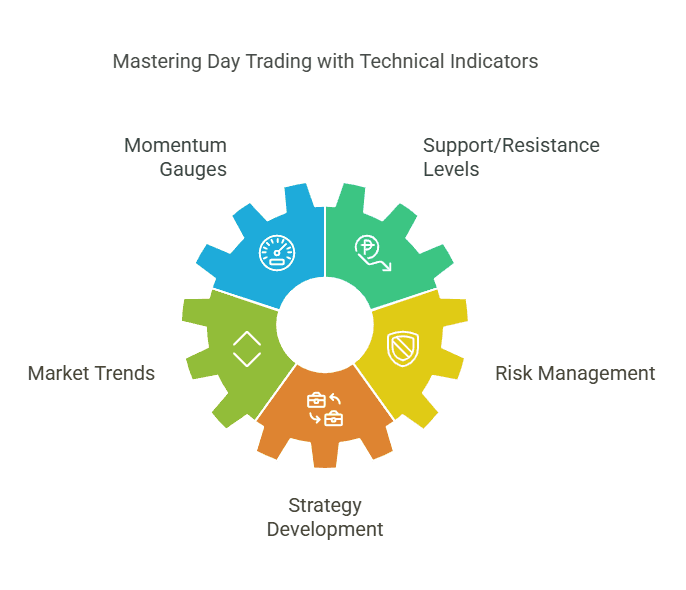
Best technical indicators for day trading are the foundational tools that every day trader should understand in order to read price action swiftly and make informed decisions. Whether you are completely new to the markets or looking to refine your strategies, these indicators help you cut through the noise and interpret what’s really happening behind the scenes of each price movement. In the world of fast-paced, intraday positions, having reliable indicators can make the difference between a profitable trade and a missed opportunity.
In this comprehensive guide, we’ll explore how these best technical indicators for day trading work, why they matter, and how you can combine them to create robust trading strategies. From gauging market momentum to identifying key support/resistance levels, each indicator serves a specific purpose. But remember, no single indicator can guarantee success. Day trading is as much an art as it is a science, requiring practice, discipline, and a willingness to adapt.
Let’s dive in.
An Overview of Best technical indicators for day trading
Before we zoom in on individual tools, let’s take a step back and understand the broader picture. Technical indicators are mathematical calculations applied to a trading instrument’s price or volume data. They transform raw data into digestible forms—such as oscillators, moving averages, or volatility ranges—that help you spot patterns, trends, and potential pivot points.
What Are Technical Indicators?
Technical indicators are formulas or statistical calculations that traders use to derive insights from a security’s price action and volume data. They are designed to simplify market data so that you can quickly gauge momentum, trend direction, volatility, or other market dynamics.
Why Use Them?
- Noise Reduction: Markets can be noisy. Indicators help smooth out this noise to highlight significant shifts or patterns.
- Objective Analysis: Indicators offer quantifiable data points, reducing the subjectivity of chart reading.
- Timing: They help pinpoint when to enter or exit trades, particularly important in day trading where timing is everything.
Types of Indicators
- Trend Indicators: Examples include Moving Averages and MACD. They help identify the prevailing direction of the market.
- Momentum Indicators: RSI and Stochastic Oscillator fall under this category, revealing how strong current price movements are.
- Volatility Indicators: Bollinger Bands and ATR help gauge market volatility and potential price breakouts.
- Volume Indicators: Tools like Volume Weighted Average Price (VWAP) integrate volume into price analysis.
Why Mastering Best technical indicators for day trading Matters
Day trading is a sprint. Traders often open and close positions within the same day, aiming to capitalize on small but meaningful price fluctuations. This environment requires quick reflexes and an even quicker way to interpret price data. Mastering best technical indicators for day trading can expedite your ability to spot potential reversals, breakouts, and areas where the market might shift from bullish to bearish—or vice versa.
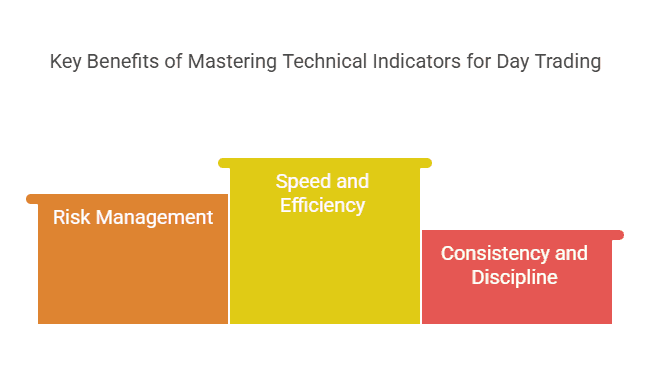
Speed and Efficiency
- Immediate Feedback: Indicators give near-instant feedback on price changes. This immediacy is vital when trading multiple tickers or scanning the markets for opportunities.
- Filtering Trades: When you see a certain setup on the chart—like an RSI oversold signal or a MACD crossover—it can serve as a quick filter to decide if a trade is worth considering.
Risk Management
- Stop-Loss Placement: Volatility-based indicators (like ATR) help you set more informed stop-loss levels.
- Position Sizing: Knowing the momentum and volatility can guide how large or small your position should be to manage risk effectively.
Consistency and Discipline
- Pre-Defined Rules: Indicators can form the foundation of trading systems with rules that minimize emotional trading.
- Backtesting: By reviewing historical data, you can test how well a combination of indicators might have performed, thereby building confidence in your strategy.
Combining Indicators
- Confluence: The strongest signals often occur when multiple indicators agree. For example, an RSI oversold region coinciding with a key moving average support can bolster a bullish setup.
- Avoiding Redundancy: Not all indicators mix well. If multiple indicators measure the same thing (like momentum), you might be double-counting the same signal. Keep your chart uncluttered with just the essentials.
Indicator #1: Relative Strength Index (RSI)
The Relative Strength Index (RSI) is among the most popular and accessible momentum oscillators. It measures the speed and change of price movements, oscillating between 0 and 100. Traders often view readings above 70 as overbought and below 30 as oversold.
How RSI Works
Developed by J. Welles Wilder, the RSI compares the magnitude of recent gains to recent losses to gauge if a security’s price may be overextended. Essentially, it helps you determine if the market is potentially poised for a pullback (if RSI is high) or a bounce (if RSI is low).
Key Levels
- Overbought (70+): Signals that buying momentum may be unsustainable. A reversal or consolidation could be imminent.
- Oversold (30-): Suggests selling pressure could be reaching exhaustion, hinting at a possible upward turn.
RSI Divergence
One of the most powerful uses of RSI is spotting divergences. For instance:
- Bullish Divergence: Price makes a lower low, but RSI makes a higher low. This could indicate weakening bearish momentum.
- Bearish Divergence: Price makes a higher high, but RSI prints a lower high, suggesting diminishing bullish pressure.
Day Trading Applications
- Quick Entries: Intraday traders often look for short-term RSI dips below 30 or spikes above 70 to catch swift reversals.
- Filtering Trades: You can combine RSI with a moving average to ensure the overall trend is in your favor, only taking RSI signals that align with the broader market direction.
Tips for Effectiveness
- Adjust Periods: While the default RSI period is 14, some day traders shorten it to 7 or 9 to make it more responsive to intraday moves.
- Use in Conjunction: Always confirm RSI signals with price action or a second indicator.
- Avoid Relying Solely on Overbought/Oversold: Markets can stay overbought or oversold for extended periods, especially in strong trending environments.
RSI can be extremely effective for intraday traders seeking swift clues about momentum. By understanding its oscillations and potential divergences, you add a reliable weapon to your day trading toolkit.
Moving Average Convergence Divergence (MACD)
The Moving Average Convergence Divergence (MACD) is another popular momentum-based indicator that also reveals trend direction. Created by Gerald Appel, the MACD calculates the difference between two exponential moving averages (EMAs), usually the 12-period and 26-period EMAs. A signal line (typically the 9-period EMA of the MACD line) helps generate trading signals.
Components of MACD
- MACD Line: The difference between the 12-period EMA and 26-period EMA.
- Signal Line: A 9-period EMA of the MACD line that helps confirm buy or sell signals.
- Histogram: Plots the difference between the MACD line and the signal line. When the histogram crosses zero, it can signal a change in momentum.
How Traders Use MACD
- Crossover Signals: A bullish signal occurs when the MACD line crosses above the signal line, while a bearish signal occurs when it crosses below.
- Zero Line Cross: When the MACD line crosses above zero, it indicates an uptrend; crossing below zero signals a downtrend.
- Divergence: Similar to RSI, divergences between MACD and price can hint at trend reversals.
Day Trading Specifics
- Shorter Settings: For intraday trading, some traders adjust the default 12-26-9 settings to something faster (e.g., 6-13-5) to capture shorter-term swings.
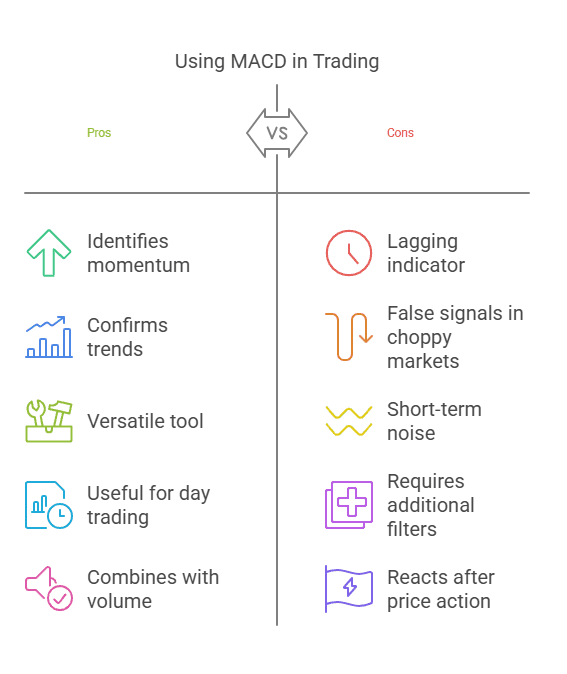
- Confirming Trend: MACD can serve as a quick reference to confirm if the market is more bullish or bearish on your chosen timeframe.
- Combine With Volume: Some traders verify MACD crossovers with an increase in volume to gauge the strength of momentum shifts.
Limitations
- Lagging Indicator: MACD is based on moving averages, so it reacts after price action has occurred. Quick whipsaws can cause false signals in choppy markets.
- Short-Term Noise: Intraday fluctuations can create multiple crossovers, so using MACD on lower timeframes might demand added filters (e.g., support/resistance lines or volume indicators).
When used correctly, MACD is a versatile tool for spotting shifts in momentum and clarifying the market’s prevailing trend, making it a go-to for both novice and experienced day traders.
Indicator #3: Bollinger Bands
Bollinger Bands, developed by John Bollinger, give a visual sense of volatility by plotting two bands around a moving average—usually a 20-period Simple Moving Average (SMA). These bands expand and contract based on market volatility, offering clues about potential breakouts or periods of consolidation.
Components of Bollinger Bands
- Middle Band: The 20-period SMA (by default), serving as the base.
- Upper Band: Plotted two standard deviations above the SMA.
- Lower Band: Plotted two standard deviations below the SMA.
Bollinger Band Squeeze
- Contraction: When bands pinch together, volatility is low. This scenario, often called a “squeeze,” may precede a sharp price movement
- Expansion: When bands widen, volatility is high. You might see price “walk the band,” continually touching the upper or lower band in a strong trend.
Trading Applications
- Reversion to the Mean: Some traders expect price to revert to the middle band after touching an extreme band.
- Breakout Trades: When a Bollinger Band squeeze resolves, a breakout can occur in either direction. Traders often wait for confirmation (e.g., a candle closing outside the band).
- Trend Confirmation: In an uptrend, price often rides the upper band; in a downtrend, it rides the lower band.
Best Practices for Day Traders
- Look for Confluence: Combine Bollinger Bands with an oscillator like RSI for confirmation. For example, if price touches the lower band and RSI signals oversold, it may be a stronger long setup.
- Avoid Choppy Markets: Tight, sideways markets can cause multiple “fakeout” breaks outside the bands.
- Adjust Settings: Depending on your chosen asset and timeframe, consider adjusting the standard deviation or the SMA period for better responsiveness.
Bollinger Bands excel at providing insights into volatility, helping you see if an asset is overextended. For day traders, they can be a powerful tool to anticipate breakouts or gauge pullbacks within the broader trend.
Indicator #4: Simple and Exponential Moving Averages
Moving averages (MAs) are the bread and butter of technical analysis. They smooth out price data to identify the overall trend, making it easier to spot direction and possible turning points. The two most common types are Simple Moving Averages (SMAs) and Exponential Moving Averages (EMAs).
Simple Moving Average (SMA)
- Calculation: Averages price data over a specified number of periods, giving each period equal weighting.
- Common Periods: 20, 50, and 200 are popular choices to capture different trend lengths (short, medium, and long term).
Exponential Moving Average (EMA)
- Calculation: Similar to SMA but gives more weight to recent prices, making it more responsive to current market conditions.
- Common Periods: 9, 21, and 50 are often used by day traders for quicker signals.
How to Use Moving Averages in Day Trading
- Trend Identification: If price is above the moving average, the trend is generally up; if below, it’s down.
- Crossover Signals: When a faster MA (like the 9 EMA) crosses above a slower MA (like the 21 EMA), it can signal a bullish shift—and vice versa for a bearish shift.
- Support/Resistance: MAs can act like dynamic support/resistance levels. Price often bounces around these lines.
Strategies
- Pullback Entries: In a strong uptrend, waiting for price to pull back to the 20 EMA or 50 SMA before entering a long position can provide a better risk-to-reward ratio.
- Scalping: On very short timeframes, you might use multiple EMAs to quickly gauge momentum shifts.
Key Considerations
- Lagging Indicator: Moving averages follow price, so they may not be the best for pinpointing exact tops or bottoms.
- Market Conditions: MAs tend to work better in trending markets. In choppy or range-bound conditions, you may see multiple whipsaws.
For many day traders, moving averages form the core of their strategies. They’re straightforward, visually intuitive, and can serve as a backbone for combining more advanced technical indicators.
Indicator #5: Stochastic Oscillator: A Powerful Best technical indicators for day trading
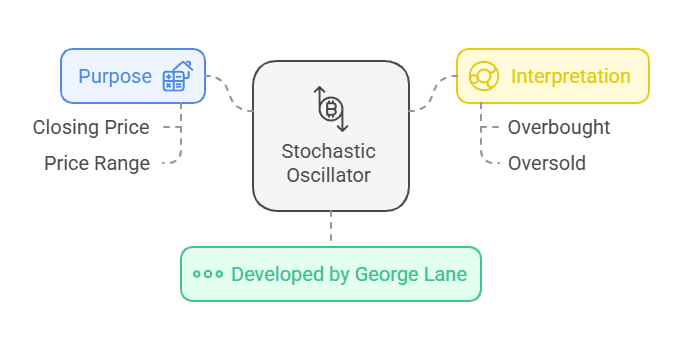
Developed by George Lane, the Stochastic Oscillator is a momentum indicator comparing a security’s closing price to its price range over a given period. It ranges from 0 to 100, with readings above 80 often considered overbought and below 20 oversold.
How It Works
- %K Line: The main line showing the current price relative to its recent trading range.
- %D Line: A simple moving average of %K, acting as a signal line.
When %K crosses above %D in the oversold region, it often signals a potential bullish move. Conversely, when %K crosses below %D in the overbought region, it could signal a bearish move.
Uses in Day Trading
- Fast Momentum Shifts: The Stochastic Oscillator is sensitive to price changes, making it suitable for quick, intraday analyses.
- Divergence: As with RSI, divergences between the Stochastic Oscillator and price action can indicate looming trend reversals.
- Multiple Timeframes: Some traders use a “Stochastic in multiple timeframes” approach, waiting for alignment in both a lower (e.g., 5-minute) and a higher timeframe (e.g., 15-minute) chart.
Trading Tips
- Combine with Support/Resistance: If a Stochastic buy signal appears right near a known support level, this confluence can strengthen the case for a bullish trade.
- Use Fast or Slow Stochastics: Slow Stochastics smooth the lines, reducing whipsaws, which can be particularly beneficial in day trading.
- Avoid Chasing Overbought/Oversold: Like RSI, a market can remain overbought or oversold longer than you expect. Always look for confirmation.
The Stochastic Oscillator remains a powerful best technical indicators for day trading because it gives real-time insights into momentum shifts. When used with a methodical approach, it can sharpen your market entries and exits.
Indicator #6: Volume Weighted Average Price (VWAP): An Essential Best technical indicators for day trading
Volume Weighted Average Price (VWAP) calculates the average price of a security weighted by trading volume, making it especially useful for day traders who want to see the “fair” or “true” price based on volume. Unlike simple moving averages, VWAP places emphasis on the price levels where high volume has occurred.
Why VWAP Matters
- Institutional Benchmark: Many large traders and institutional desks watch VWAP to gauge if they’re buying below or selling above the average market price.
- Intra-Day Only: VWAP resets each day, making it ideal for day trading but less relevant for longer-term analysis.
How to Use VWAP
- Trend Indicator: Price trading above VWAP is considered bullish; below is bearish.
- Support/Resistance: Intraday, VWAP often acts as a magnet for price. When price approaches VWAP from above, it may act as support; from below, it may act as resistance.
- Trading Pullbacks: In an uptrend, traders might wait for price to dip to VWAP to either initiate or add to positions.
Considerations
- Confluence: Combining VWAP with another indicator—like Bollinger Bands or RSI—can create more robust entry and exit signals.
- Low Volume Pitfalls: On days or in markets with unusually low volume, VWAP readings may be less reliable.
- Multiple VWAP: Some charting platforms allow you to plot multiple VWAP lines with different anchors (e.g., session-based, weekly, monthly). For pure day trading, the session-based VWAP is typically the most relevant.
Indicator #7: Fibonacci Retracements: A Timeless Best technical indicators for day trading
Fibonacci Retracements are not exactly an “indicator” in the same sense as RSI or MACD, but they serve a similar purpose: identifying key price levels. Based on the Fibonacci sequence (0, 1, 1, 2, 3, 5, 8, 13, 21...), the most commonly used retracement levels are 23.6%, 38.2%, 50%, 61.8%, and 78.6%.
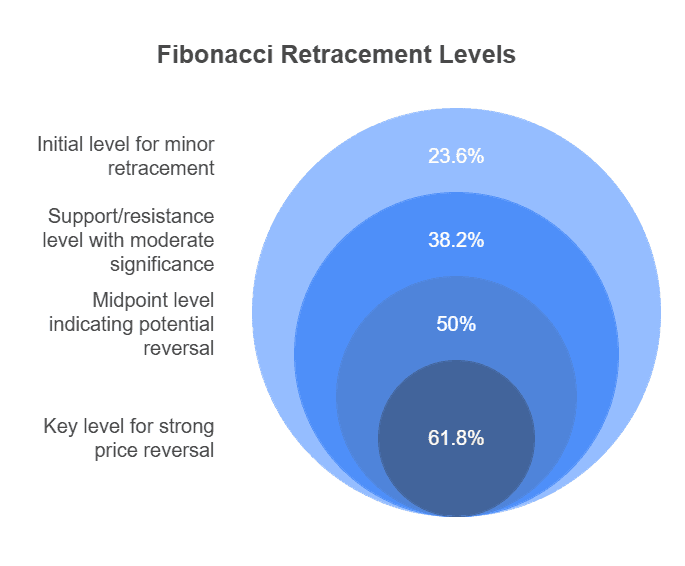
Plotting Fibonacci Retracements
- Identify a Major Move: Choose a significant swing high and swing low.
- Draw the Fib Tool: Your charting software will automatically plot the retracement levels between these two points.
Why They Work
Fibonacci numbers appear frequently in nature and finance alike. Many traders—both retail and institutional—use these levels, making them self-fulfilling to some degree. You’ll often see price pause or bounce at one of these retracement levels.
Day Trading Applications
- Dynamic Support/Resistance: Once drawn, you can watch how price reacts at key retracement levels during the day.
- Entry and Exit Points: Traders often wait for price to touch or break through a retracement level before entering a trade.
- Combining with Other Indicators: A confluence of a Fibonacci level, a moving average, and an RSI oversold reading can offer a high-probability setup.
Best Practices
- Match to Timeframe: Use Fibonacci retracements relevant to your trading timeframe. For day traders, that often means identifying the major swing high and low from the intraday chart.
- Complement, Don’t Replace: Fibonacci levels shouldn’t be your only reason to enter a trade. Confirm with trend direction or momentum indicators.
- Watch for Extensions: Besides retracements, Fibonacci extensions (like 127.2% or 161.8%) can predict potential profit targets once price surpasses the initial swing points.
Indicator #8: Average True Range (ATR): A Volatility-Based Best technical indicators for day trading
Average True Range (ATR), introduced by J. Welles Wilder, measures market volatility. It calculates the average range between high and low over a specific period (typically 14 bars). While it doesn’t predict price direction, it informs you how much an asset might move during a given timeframe.
Why ATR Is Useful
- Volatility Gauge: High ATR values indicate heightened volatility, whereas low values imply calm market conditions.
- Stop-Loss Placement: Many traders use a multiple of the ATR (e.g., 2x ATR) to set stop-loss levels beyond normal price fluctuations.
Day Trading Applications
- Position Sizing: If you know an instrument’s typical intraday range, you can better size your position to account for risk.
- Trade Timing: An expanding ATR can signal a potential breakout or an acceleration of momentum. A narrowing ATR might mean the market is consolidating.
- Avoid Overexposure: If ATR is high, you might trade smaller position sizes to limit risk in volatile conditions.
Combining With Other Indicators
- Trend Indicators: Using ATR alongside moving averages can highlight not only the trend direction but also how volatile that trend might be.
- Breakout Filters: If you see a breakout from a Bollinger Band squeeze accompanied by a rising ATR, it may confirm that volatility is ramping up, reinforcing the breakout’s validity.
The Average True Range (ATR): A Volatility-Based Best technical indicators for day trading can be an invaluable tool in your day trading arsenal. Knowing the potential range of price movement can help you avoid premature exits and better manage your risk.
Conclusion: Mastering Best technical indicators for day trading
Best technical indicators for day trading provide a structured, data-driven way to interpret fast-moving price action. From momentum oscillators like RSI and the Stochastic Oscillator to volatility tools like Bollinger Bands and ATR, each indicator offers its own layer of insight. Some excel at identifying trend direction (Moving Averages, MACD), while others help pinpoint high-probability turning points (Fibonacci Retracements, VWAP). No single indicator guarantees consistent profits, but the right combination—backed by disciplined execution—can greatly enhance your decision-making process.
Always remember:
- Context Is Key: Evaluate market conditions (trending, choppy, volatile) before choosing which indicators to rely on.
- Practice Risk Management: Use volatility measures, like ATR, or volume-based signals, like VWAP, to help set realistic stop-loss levels and position sizes.
- Adapt and Evolve: Markets change. Periodically review your indicator settings, strategies, and overall approach.
- Avoid Overloading: Too many indicators can cloud your judgment. Keep your chart clean and focus on a few core tools that complement your trading style.
Ultimately, the goal is to craft a personal trading framework where you understand how and why you are using each tool. By learning to read these best technical indicators for day trading and applying them with consistency, you’ll be well on your way to sharpening your intraday edge. Remember, trading success is a process—continue to educate yourself, stay disciplined, and adapt to the ever-evolving market dynamics. Good luck and happy trading!
Ready to take your day trading to the next level?
With TradeSearcher.ai, you can instantly find and test strategies that leverage these 8 best technical indicators for day trading. Explore smarter strategies and boost your trading confidence today!
