Table of Content
Historical Data: Best Libraries and Tools to Get Historical Data in Python
By Vincent NguyenUpdated 400 days ago
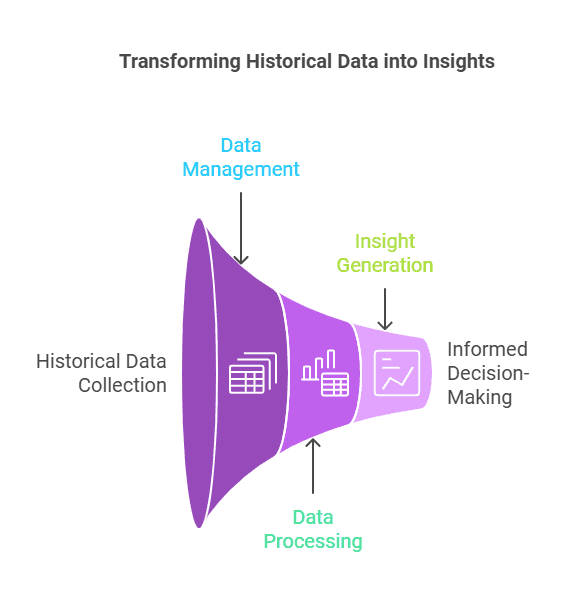
Mastering Historical Data: From Trends to Actionable Insights
Historical data is essential for understanding price indices, consumer price inflation statistics, and balance of payments trends. It reveals past patterns and helps analyze asset prices, daily trading volumes, and other critical metrics. By studying historical data, we uncover insights that guide decisions, from calculating option prices to tracking consumer price inflation time.
This beginner-friendly guide covers gathering and managing historical data in Python, including handling CSV format, using scalable cloud storage, and working with legacy systems. We’ll explore practical steps and real-world examples, illustrating how to build a comprehensive database for reliable analysis.
You’ll also learn methods to process data from cross-national sources and tools like APIs to simplify data collection. With clear explanations and actionable tips, this guide will equip you to turn historical data into actionable insights for a range of applications.
Historical Data Basics and Its Importance
Historical data refers to recorded information about past events, behaviors, or statistics that reflect economic systems, population growth, or even daily volume trends on trading days. It stretches back through community histories, document history records, and electoral history archives, offering a snapshot of how things once were. This data can come from digital collections, annual vintage dataset sources, or present-day countries that maintain archives of legacy systems.
Why Historical Data Matters
- Trend Detection: Historical data is the backbone of anomaly analysis, balancing retrospective insights with future modeling. It plays a key role in National Accounts and quarterly accounts analysis, helping analysts see the 12-month growth rates of key metrics like birth rates or vaccination rates.
- Research and Forecasting: Researchers or investors check history database sources to improve predictions for asset prices, consumer price statistics, or the balance of payments. Even consumer price inflation statistics rely heavily on older figures to see how an ANNUAL RATE has changed over time.
- Decision-Making: From small businesses to large institutions, many rely on joined-up accounts that factor in historical data to shape policies or expansions. This might include measuring Cboe Volume and Cboe Total Exchange Volume to evaluate how daily volume changes with shifting market conditions.
Real-World Use Cases
- Financial Markets: Analysts study consumer price inflation time records, daily trading volumes, and Price indices to refine the calculation of option prices. A thorough understanding of these figures over trading days helps them forecast how a market might react to new policies or events.
- Economic Studies: Economists might look at monthly or yearly data for comprehensive database sets. They can focus on cross-national and international data collections, balancing them with local details, such as British population reports or booming populations in certain regions. This allows them to track broader trends from country to country.
- Energy and Environment: In advanced applications, historical data guides multi-step energy prediction in a Cloud Based Smart Living System Prototype. By analyzing older energy consumptionBuilding1hour24hour24R2 logs, data scientists optimize energy prediction accuracy and refine policy-making strategies.
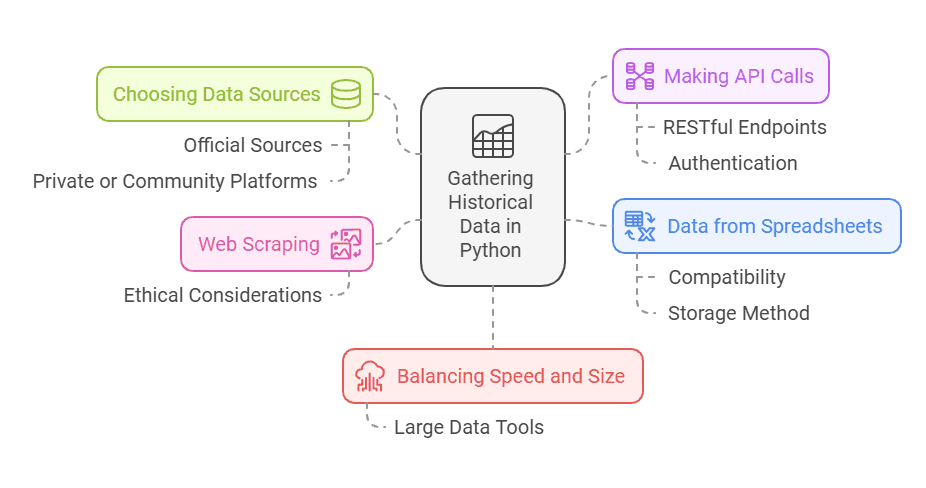
How to Gather Historical Data in Python
Python offers numerous ways to fetch historical data, no matter if your focus is statistical publications, additional publications, or even a sibling dataset dealing with daily basis updates. Beginners often find Python’s ease of use appealing, especially when they discover straightforward methods to query large data repositories.
1. Choosing Data Sources
Select reliable datasets, whether from government portals with economic statistics publications, or from specialized resources. You might find Cboe Equity Option Volume data, or you could gather broad-based National Accounts. Many reputable sites provide downloadable publications, while others offer an API format.
Official Sources:
- Central Banks: Some central banks publish historical records of balance sheet data, consumer price statistics, and allied figures.
Statistical Offices: Government agencies release economic systems metrics in a standardized, accessible format. This might include distribution of sales periods data or historical records on electoral history.
Private or Community Platforms:
- Cross-National and International Data Collections: Ideal for analyzing the post-WW2 period or pre-ESA95 system legacy details.
Community Histories: Smaller organizations often hold document history archives. They might also share data about present-day countries and how they manage code of accounts.
2. Making API Calls
APIs are a popular way to retrieve data swiftly. Many data providers allow free or tiered access. This can reduce the burden of storage administration on your local machine because you only pull what you need.
- RESTful Endpoints: Some providers release daily or monthly updates with daily trading volumes or consumer price inflation statistics.
- Authentication: Many APIs require a key. Store it securely to avoid unauthorized usage and to comply with data-sharing agreements.
3. Web Scraping
Not all historical data sits neatly behind an API. You can employ web scraping via Python libraries such as requests and BeautifulSoup. This method can help you gather data from legacy systems that host older pdf scans, or from digital collections that do not yet have an API format.
- Ethical Considerations: Always check the terms and conditions of each site. Respect robots.txt files, and avoid overloading servers with too many requests.
4. Data from Spreadsheets
Sometimes you need to gather data from an Excel file. You might find a (51.34 KB - Excel Spreadsheet) or multiple sheets in a single file. Python’s pandas library can open these resources just as readily as csv format files.
- Compatibility: Make sure you have compatible spreadsheet programs if you plan to convert the data for broad usage.
- Storage Method: Evaluate the best place to keep your files. Cloud storage scalability can be a huge advantage if you plan to expand your operation.
5. Balancing Speed and Size
When dealing with large sets, watch out for daily volume constraints and memory usage. You might face big data challenges if you load too many rows at once. Tools like Dask can help you process large data across multiple cores.
Essential Tools and Libraries for Historical Data
Python developers lean on multiple libraries for extracting, analyzing, and visualizing historical data. These tools make tasks like anomaly analysis or the preparation of a balance sheet far simpler. They also speed up tasks such as the retrieval of Cboe Total Exchange Volume, Cboe Volume, or country to country data comparisons.
Pandas
Pandas is a go-to library for handling structured data in Python. It is excellent for reading csv format files, Excel spreadsheets, or making quick API calls. DataFrames let you organize historical data, rename columns, or drop duplicates from older record sets. Short code snippets can gather daily trading volumes, shift columns for joined-up accounts, or parse time-based data to evaluate consumer price inflation time.
- Key Advantage: Pandas merges new data with older archives swiftly, which helps when investigating consumer price inflation statistics or building a history database.
- Quick Example:
python
Copy codeimport pandas as pd
df = pd.read_csv('historical_data.csv')
# Inspect the first few rows
print(df.head())
NumPy
NumPy is essential for numerical operations and arrays. When you handle computations tied to Ryland Thomas’s approach to macroeconomic models, or when you analyze multiple columns of daily basis data, NumPy accelerates your workflow.
- Use Cases:
Quick calculations for the calculation of option prices
1. Rolling means for consumer price statistics
2. Aggregating large data for cross-national and international data collections
Matplotlib and Seaborn
Visualizing historical data is vital for spotting trends in daily trading volumes, Price indices, or even population changes. Matplotlib offers a solid baseline, and Seaborn adds style with just a few lines of code.
- Matplotlib: Perfect for line charts of Cboe Equity Option Volume over time, or bar graphs of the ANNUAL RATE of inflation.
- Seaborn: Excellent for creating visually pleasing box plots and distribution graphs of consumer price inflation statistics or birth rates.
Requests and BeautifulSoup
As mentioned earlier, scraping can help you gather data from digital collections that might not be in a convenient downloadable format. You can parse any document history or community histories from websites that share them in HTML form.
- Requests: Fetch raw HTML or PDF links.
- BeautifulSoup: Parse the HTML to extract tables or relevant text (like an electoral history summary or a daily volume summary).
SQLAlchemy
Not all data is stored in CSV or Excel files. A code of accounts system might exist inside a relational database. SQLAlchemy helps you interact with databases using Pythonic methods.
Benefits:
- Integrate with your existing balance sheet data
- Access older distribution of sales periods archives
- Manage data for large pre-ESA95 system queries
Data Cleaning and Preprocessing Historical Data
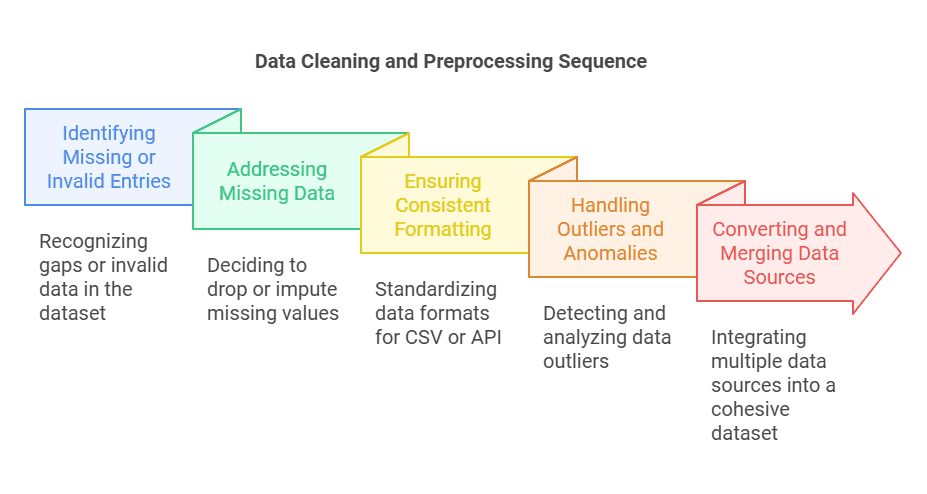
When working with historical data, researchers, analysts, and data enthusiasts alike must pay attention to data quality. Even the best comprehensive database might contain outliers, missing entries, or mislabeled columns. Cleaning and preprocessing is crucial for preserving the accuracy of any subsequent statistical analysis. Below are the main steps to consider:
Identifying Missing or Invalid Entries
Common Issues: Gaps appear in legacy systems, especially if you have an annual vintage dataset that spans several decades or a sibling dataset that complements the main file. Missing cells can disrupt the calculation of option prices, daily trading volumes, or consumer price inflation time.
Solutions:
Drop or Impute: With Python libraries like Pandas, you can drop rows entirely or fill them with mean, median, or zero-based imputation. This prevents skewing your end metrics.
- Date Alignment: Confirm that dates from cross-national and international data collections align with a standardized daily basis or monthly basis. Errors in time zones or week numbering can distort your final results.
Consistent Formatting for CSV or API Data
CSV Format: If your primary storage method is CSV, watch for mismatched separators (commas vs. semicolons) and ensure columns line up across multiple files. Failing to standardize leads to confusion when merging data from different present-day countries, code of accounts archives, or historical records from the post-WW2 period.
API Format: For data pulled through an API format, confirm that variable names match your DataFrame columns. Manually rename columns if needed, and discard duplicates.
Accessible Format: Whether you deal with daily volume data or multi-step energy prediction logs, aim for widely compatible spreadsheet programs if you plan to share the data or store it in a central repository.
Handling Outliers and Anomalies
Identify Outliers: Use statistical publications or additional publications to confirm normal ranges. A spike in Cboe Equity Option Volume or an unusually high birth rate might signal an anomaly that needs deeper investigation.
Anomaly Analysis: Create boxplots or z-score tests to reveal data points that deviate from standard patterns. Be mindful of whether these outliers reflect real events—like booming populations after a major policy change—or mere data entry errors.
Converting and Merging Multiple Sources
Merging Techniques: Many data projects involve merging a sibling dataset with a main file, or combining a distribution of sales periods dataset with an annual vintage dataset. Pandas merge or concat functions unify these tables.
Joins and Keys: Ensure each row has a consistent key, such as a date or an ID. Missing keys can misalign your data on a daily basis, skewing results for consumer price inflation statistics, Cboe Volume, or British population reports.
Storing and Managing Historical Data Efficiently
Deciding where and how to store historical data affects everything from daily volume queries to the burden of storage administration. You might rely on a local environment, a cloud storage scalability solution, or a hybrid approach. Here are the main considerations:
Local vs. Cloud Storage
Local Storage: Simple but can become expensive in terms of hardware as your dataset grows. Ideal for smaller tasks, like analyzing a subset of consumer price statistics or short-term data that updates on a daily basis.
Cloud Storage: Scales well for big data, including cross-national and international data collections. Reduces the overhead of server maintenance. Consider solutions like AWS S3 or Google Cloud Storage for storing daily trading volumes and National Accounts.
Database Solutions
SQL Databases: Tools like MySQL or PostgreSQL handle structured data effectively. They help manage millions of rows, whether it’s a code of accounts table or an expanded history database that includes distribution of sales periods.
NoSQL Databases: Ideal for unstructured or semi-structured data, especially if you’re gathering document history logs or community histories from multiple sources.
Version Control and Backups
Git for Data: Storing large files in Git isn’t always ideal, but version control for smaller CSV files can be valuable. This is helpful if you need to revert to older data sets or compare data changes over time.
Scheduled Backups: Tools like cron jobs ensure you keep an updated snapshot of your daily or monthly data. This can be vital for electoral history records, which might need to be accessible for decades.
Data Security and Access
Authentication: Limit who can retrieve or alter crucial archives like the pre-ESA95 system records or older British population reports.
Encryption: Whether your data is at rest or in transit, encryption protocols protect sensitive information. This is especially important if you store personal details or commercial data tied to the calculation of option prices.
Analyzing and Visualizing Historical Data
After gathering, cleaning, and storing your historical data, the next step is turning raw numbers into insights. From Cboe Total Exchange Volume trends to consumer price inflation time series, Python’s ecosystem has you covered.
Basic Statistical Analysis
Descriptive Stats: Libraries like Pandas and NumPy can calculate means, medians, standard deviations, and correlation coefficients. This gives you a quick overview of how daily volume might change across different trading days or how vaccination rates evolve year over year.
Time Series Analysis: Tools like statsmodels let you investigate seasonal patterns in daily trading volumes or the ANNUAL RATE changes in price indices.
Advanced Analytics and Forecasting
Machine Learning Models: Scikit-learn and TensorFlow handle complex models that predict future consumer price statistics or asset prices. By training on historical data, you can anticipate how markets or populations might shift.
Multi-step Energy Prediction: In a Cloud Based Smart Living System Prototype, you can use historical data to predict energy consumptionBuilding1hour24hour24R2. This helps refine energy prediction accuracy and plan for peak usage times.
Data Visualization Techniques
Line Charts for Trends: Ideal for tracking monthly consumer price inflation statistics or quarterly accounts over time.
Scatter Plots for Correlations: Visualize how two metrics—like daily trading volumes and consumer price inflation time—relate to each other.
Heatmaps for Cross-Sections: Examine cross-national and international data collections side by side, revealing how country to country differences evolve.
Presenting Insights to Stakeholders
Dashboards: Interactive dashboards built with Plotly Dash or Streamlit can deliver real-time updates for daily volume data.
Reports: For a more formal setting, export your final figures and graphs into compatible spreadsheet programs or PDF reports. Insert bullet-point summaries of your main findings, whether you’re discussing booming populations in certain regions or the distribution of sales periods data.
Common Pitfalls and Troubleshooting for Historical Data
Analyzing historical data can be challenging, even with solid processes. Below are common pitfalls and troubleshooting tips to address them:
1. API Rate Limits and Connectivity Issues
APIs often have daily or monthly request limits, causing sudden blocks if exceeded.
- Solutions: Cache frequently used data locally in a CSV format or database. Schedule requests during off-peak hours using tools like cron to automate daily calls.
2. Data Inconsistencies Across Multiple Sources
Sources may label columns differently (e.g., “Population” vs. “pop”) or deliver data in inconsistent time frames (e.g., monthly vs. quarterly accounts).
- Solutions: Create a master schema to standardize names and formats. Align time frames to ensure datasets like daily trading volumes match consumer price statistics.
3. Overlooking Data Quality Checks
Skipping validation can lead to flawed analyses, especially for consumer price inflation statistics or sales period distributions.
- Solutions: Use validation scripts to identify anomalies and define thresholds for daily volume or asset prices. Cross-reference datasets for consistency.
4. Outdated or Deprecated Libraries
Older libraries may become incompatible with updated Python versions.
- Solutions: Monitor dependencies, transition to supported tools, and use virtual environments to isolate legacy setups when necessary.
Real-World Examples Using Historical Data
The best way to learn is by seeing real-world scenarios where historical data drives decisions. Let’s explore a few illustrative examples:
Predicting Stock Market Trends
Context: A small investment group wants to forecast asset prices for medium-term trades. They gather data from multiple cross-national and international data collections, including Cboe Equity Option Volume and Cboe Total Exchange Volume.
Approach:
Data Gathering: Use Python scripts to pull daily trading volumes via API format.
- Data Cleaning: Align time zones and standardize column names to match the code of accounts format used internally.
- Modeling: Employ a basic time series model (e.g., ARIMA) to predict next-month prices.
Outcome: This approach yields improved forecasts for the calculation of option prices, enabling the group to better manage risk during trading days.
Household Energy Consumption Forecast
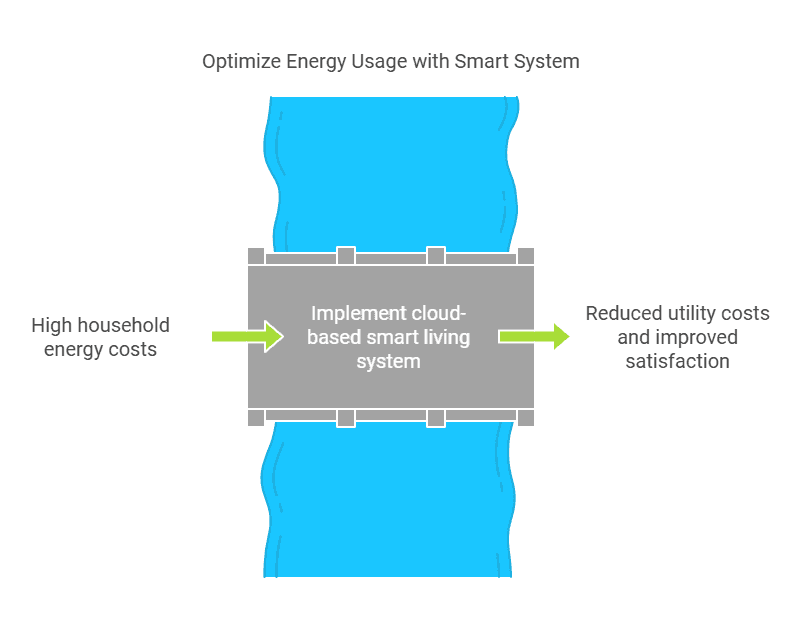
Context: A home automation startup builds a Cloud Based Smart Living System Prototype to optimize daily energy usage. They collect multi-step energy prediction data from sensors that track real-time usage.
Approach:
Historical Data Assembly: Merge older consumption logs from a pre-ESA95 system with updated logs from present-day sensors.
- Data Preprocessing: Convert all time stamps to a standard format for daily basis comparisons. Validate missing entries using forward-filling techniques.
- Machine Learning: Employ advanced models (e.g., LSTM networks) to maximize energy prediction accuracy for consumptionBuilding1hour24hour24R2.
Outcome: With stable, accessible format data storage, the startup lowers household utility costs and improves user satisfaction.
Economic Policy Analysis
Context: A research center studies the British population reports and the balance of payments data to inform policy decisions. They reference community histories to see how the economy evolved over the post-WW2 period.
Approach:
Data Collection: Pull older records from digital collections and combine them with modern consumer price inflation statistics.
- Data Cleaning: Consolidate stats from annual vintage dataset logs that might otherwise conflict.
- Analysis: Examine monthly or 12-month growth rates in inflation and output cross-correlations with birth rates or vaccination rates.
Outcome: The research leads to evidence-based recommendations for adjusting interest rates or government spending, all grounded in historical data spanning multiple decades.
Conclusion
Historical data is crucial for insights into consumer price inflation time, daily trading volumes, and broader economic systems. Gathering, cleaning, storing, and analyzing these records reveals valuable patterns to guide calculations of option prices and energy consumption forecasts. Combining older archives with recent cross-national data ensures a balanced approach that spans the post-WW2 period and beyond. Harnessing the right tools—Pandas, requests, or cloud solutions—reduces storage burdens and keeps information both secure and well-structured.
Maintaining consistent processes, you adapt to shifting demands, from studying Cboe Equity Option Volume trends to monitoring birth rates in booming populations. Ultimately, managing historical data thoroughly uncovers anomalies, drives meaningful statistics, and supports credible forecasts. Armed with these steps, you transform raw historical records into actionable knowledge for a host of real-world applications.
Leverage the power of historical data to refine your trading strategies. Use TradeSearcher to uncover insights and backtest with precision.

