Table of Content
Directional Movement Index: What It Is and How to Use It for Profitable Trading
By Vincent Nguyen
Updated 528 days ago
Guide to the Directional Movement Index
The Directional Movement Index is a powerful technical analysis tool that allows traders to measure the strength and direction of a market trend, guiding them toward more informed buy and sell decisions. Developed by J. Welles Wilder—an influential figure in the field of technical indicators—this tool has remained relevant for decades due to its effectiveness in helping traders determine whether a market is trending and how strong that trend may be. For beginners in technical analysis, the Directional Movement Index (DMI) offers clear, relatively easy-to-interpret signals that can be applied to various markets, including stocks, forex, commodities, and cryptocurrency.
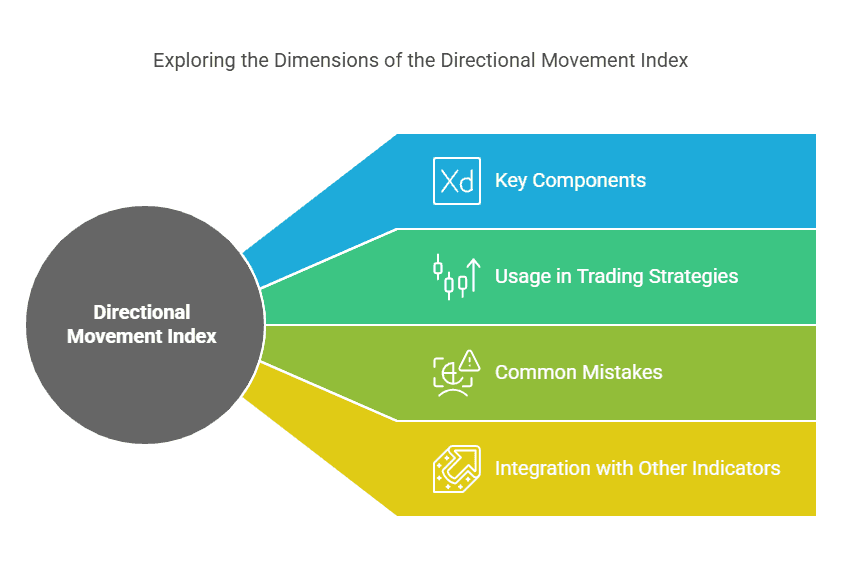
In this comprehensive guide, we will delve deeply into the key components and calculations of the Directional Movement Index, explore the logic behind its signals, and illustrate how traders can incorporate it into an overall trading strategy. You’ll also learn common mistakes to avoid, tips for combining the DMI with other indicators, and practical methods for testing your newfound knowledge without risking too much capital. By the end of this article, you should feel confident about using this indicator to enhance your trading decisions and work toward achieving consistent profitability.
Understanding the Basics of the Directional Movement Index
The Directional Movement Index (DMI) is fundamentally a trend-following system designed to identify the direction and strength of a price movement. At its core, DMI seeks to answer two crucial questions that every trader faces:
- Is the market currently trending, or is it moving sideways?
- If it is trending, how strong is that trend?
To address these questions, J. Welles Wilder introduced the DMI in his 1978 book, New Concepts in Technical Trading Systems. Despite originating decades ago, the DMI remains a mainstay among traders because it continues to provide valuable insight into market dynamics. Its objective approach transcends asset classes and has proven equally useful in traditional stock trading, forex, and even the burgeoning cryptocurrency markets.
Quick Historical Context
- J. Welles Wilder’s Legacy: Apart from the Directional Movement Index, Wilder developed other widely used technical analysis tools, such as the Relative Strength Index (RSI) and the Average True Range (ATR).
- Longevity of DMI: The fact that the DMI is still standard in many trading platforms—from MetaTrader to TradingView—attests to its ongoing relevance and effectiveness.
How the Directional Movement Index Fits into Technical Analysis
- Trend Identification: Many indicators can help you identify trends (like Moving Averages or MACD), but the DMI goes further by providing a measure of trend strength, not just direction.
- Easy-to-Interpret Signals: Beginners often appreciate the clarity offered by the DMI. Signals are generated by crossovers and specific numerical readings, reducing the guesswork sometimes associated with interpreting chart patterns.
- Broad Applicability: Whether you’re trading stocks, forex, crypto, or commodities, the DMI works under various time frames, making it versatile and adaptable to multiple trading styles (scalping, day trading, swing trading).
Essentially, the DMI can serve as a baseline for your trading decisions: if the indicator suggests a strong upward trend, you might look for buying opportunities; if it signals a strong downward trend, you might focus on short-selling or simply stay on the sidelines. As you’ll see in the following sections, the Directional Movement Index is composed of three main elements that work together to provide a comprehensive picture of market conditions.
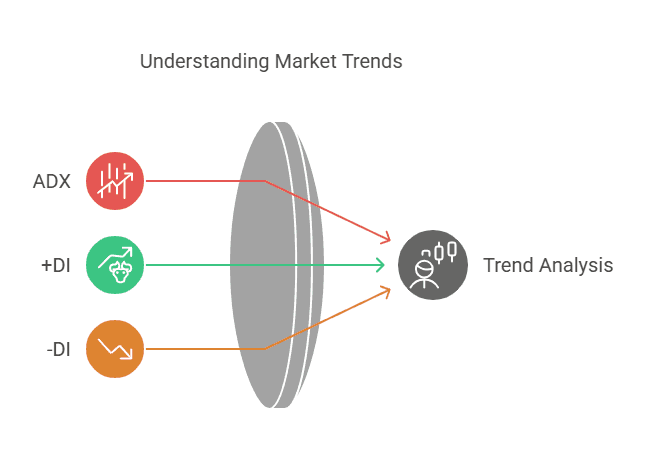
Key Components of the Directional Movement Index: ADX, +DI, and -DI
The Directional Movement Index consists of three lines or components that appear on a chart:
- ADX (Average Directional Index)
- +DI (Positive Directional Indicator)
- -DI (Negative Directional Indicator)
These three elements combine to help traders quickly gauge not only the direction of the trend but also its relative intensity. Understanding how they interact is critical to interpreting the DMI properly.
- ADX (Average Directional Index): This line typically ranges from 0 to 100. The ADX does not indicate whether a trend is bullish or bearish; rather, it measures trend strength. When ADX is high, you can expect a strong trend—whether up or down. When ADX is low, the market may be in a consolidation or ranging phase.
- +DI (Positive Directional Indicator): This line indicates upward price movement. When +DI is above -DI, it can be interpreted as the market being in a general upward trend, or at least showing signs of bullish pressure.
- -DI (Negative Directional Indicator): This line indicates downward price movement. Conversely, when -DI is above +DI, it can imply a dominant downward trend or bearish pressure.
Breaking Down the Directional Movement Index Calculation
While many traders rely on charting software to calculate the Directional Movement Index automatically, it’s still valuable to understand the logic behind the math:
1. True Range (TR)
The first step in computing DMI involves calculating the True Range, which accounts for a stock or asset’s volatility. True Range is the greatest of the following:
- Current high minus current low
- Absolute value of the current high minus the previous close
- Absolute value of the current low minus the previous close
2. Directional Movement (DM)
Positive DM (+DM):
- If the current high minus the previous high is greater than the previous low minus the current low, then +DM is that difference; otherwise, it’s zero.
Negative DM (-DM):
- If the previous low minus the current low is greater than the current high minus the previous high, then -DM is that difference; otherwise, it’s zero.
3. Smoothed Averages
- +DM and -DM are typically smoothed using a moving average (often a 14-period setting by default, but this can be adjusted).
- TR is also smoothed over the same period to derive something called the “Average True Range” (ATR), which is used in the final calculations.
4. +DI and -DI
- +DI = (Smoothed +DM / Smoothed TR) x 100
- -DI = (Smoothed -DM / Smoothed TR) x 100
5. ADX (Average Directional Index)
- The final ADX line comes from the absolute difference between +DI and -DI, divided by their sum, then averaged and smoothed over a set period.
- ADX = 100 x [ ( | (+DI) – (-DI) | ) / ( (+DI) + (-DI) ) ]
- This value is then typically smoothed with a moving average to form the final ADX reading.
You don’t need to compute this by hand every time you trade, but having a basic grasp of these steps can deepen your understanding of why the DMI lines behave the way they do on your charts.
Interpreting +DI and -DI
The crossover between +DI and -DI is one of the most significant signals in the DMI:
- Bullish Crossover: When +DI crosses above -DI, it can indicate that buyers are becoming more dominant, potentially signaling an upward trend.
- Bearish Crossover: When -DI crosses above +DI, it suggests that sellers are gaining the upper hand, hinting at a downward trend.
In isolation, +DI/-DI crossovers can be somewhat prone to false signals, especially in a choppy or ranging market. That’s where the ADX comes in: combining crossovers with a rising ADX often yields more reliable confirmations of trend changes.
Practical Examples of the Directional Movement Index in Action
To illustrate how these components come together, let’s walk through a hypothetical scenario on a stock chart:
1. ADX Rising Above 20-25
Imagine a stock drifting sideways for several weeks with ADX lingering around 15 (indicating a weak trend). Suddenly, ADX starts rising toward 20, signaling that a stronger trend could be emerging.
2. +DI Crosses Above -DI
Around the same time, +DI moves above -DI. This bullish crossover suggests buyers are starting to dominate. If ADX continues to climb above 25, it confirms the strength of the upward trend.
3. Price Action Confirmation
You see that the stock’s price has broken a key resistance level, further supporting a potential bullish move. You decide to go long (buy) as the DMI signals line up with the price breakout.
4. ADX Peaks and Begins to Decline
If ADX eventually peaks (say around 35) and starts heading down, it could be an early sign of trend weakness. +DI might still be above -DI, but a falling ADX often indicates the trend is losing momentum.
5. -DI Crosses Above +DI
Eventually, if -DI overtakes +DI and ADX remains relatively elevated, it might suggest a trend reversal to the downside. This could be a trigger to exit your bullish position or consider a short trade.
Why the Directional Movement Index Matters for Beginners
Many newcomers to trading find themselves overwhelmed by the sheer number of indicators available. The Directional Movement Index stands out for several reasons:
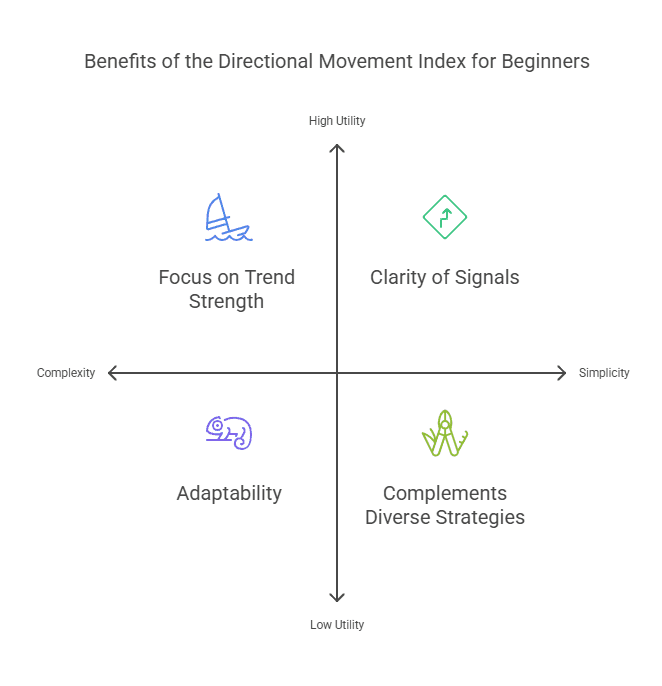
- Clarity of Signals: Some indicators require more nuanced interpretation (e.g., understanding the histogram on MACD, or deciphering the nuances of stochastics). By contrast, DMI’s +DI and -DI crossovers, combined with ADX levels, can be more straightforward for beginners to interpret.
- Focus on Trend Strength: Identifying a trend is one thing; gauging how strong that trend is can be the difference between a profitable entry and a frustrating false start. Beginners often struggle with staying out of sideways markets. ADX readings can help you avoid choppy conditions, where minor price fluctuations can trigger a series of losing trades.
- Adaptability: The DMI works on multiple timeframes—from 5-minute charts for day traders to weekly or monthly charts for long-term investors. Beginners who are still experimenting with their preferred timeframe can use the same indicator setup across different trading horizons.
- Compliments Diverse Strategies: Whether you’re a pure trend trader or someone who likes to combine indicators, the DMI can act as a universal gauge of trend quality. Pairing it with volume analysis, candlestick patterns, or support/resistance levels can create a robust trading framework.
Because the DMI’s components are relatively intuitive, it helps new traders build confidence quickly. When +DI is on top and ADX is rising, it’s a straightforward bullish environment. When -DI is on top with a strong ADX, the trend is bearish. This simplicity can help beginners learn to trust their signals and develop discipline—both of which are critical for long-term success.
How to Use the Directional Movement Index for Entry and Exit Points
One of the main practical benefits of the Directional Movement Index is its ability to offer clear signals for entries and exits. Let’s break down the process step by step.
Step 1: Check the ADX Value
- Identify Trend Strength: Before doing anything else, look at the ADX line. If the ADX is below 20, it usually indicates a weak or nonexistent trend. In such cases, you might prefer to wait for a stronger trend to develop unless you’re pursuing a range-trading strategy.
- Spot Emerging Trends: As ADX climbs above 20 and heads toward 25 or 30, it strongly suggests the market is shifting from range-bound behavior to a directional phase.
Step 2: Observe the +DI and -DI Lines
- +DI > -DI: Indicates a bullish tilt. If ADX is rising (above 20 or 25), you might consider going long.
- -DI > +DI: Indicates a bearish tilt. If ADX is also rising, you may look for short-selling opportunities or close any existing long positions.
Step 3: Confirm with Price Action
While the DMI can provide excellent clues, it’s wise to confirm signals with price action or other technical tools. For instance:
- Trendlines and Support/Resistance: If +DI crosses above -DI and ADX is rising, a breakout above a key resistance level could strengthen your conviction to enter a long position.
- Candlestick Patterns: Look for bullish candlestick formations (like bullish engulfing patterns) near your entry point for added confirmation.
Step 4: Plan Your Stop Loss and Profit Targets
- Stop Loss Placement: If you’re trading a bullish signal, place a stop loss below a recent swing low or a recognized support level to protect against false breakouts. If you’re trading a bearish signal, consider placing stops above a recent swing high or a known resistance area.
- Profit Targets: You can use the ADX to help gauge when the trend might be weakening. Alternatively, set specific risk-to-reward ratios (like 1:2) or use trailing stops to lock in gains as the price moves in your favor.
Step 5: Monitor Ongoing ADX Movements
- Rising ADX: Encourages you to hold onto the trade if it remains aligned with your entry signal.
- Falling ADX: May indicate that the current trend is losing steam. Consider tightening your stop loss or scaling out of the position to secure profits.
Example Scenario
Bullish Setup: The market was sideways with ADX around 15. Gradually, ADX rises to 22 while +DI crosses above -DI. You enter a long trade as the price breaks above a resistance zone. Over the next few days, ADX continues climbing to 30, supporting a strong bullish trend. You hold the position, trailing your stop loss below higher swing lows. Eventually, ADX rolls over from 30 down to 25, signaling diminishing momentum. You decide to exit, locking in gains.
By following a structured approach, the DMI helps you develop discipline. You have a clear rationale for when to enter, where to place protective stops, and how to ride a trend until momentum starts to wane.

Combining the Directional Movement Index with Other Indicators
Although the Directional Movement Index is robust on its own, combining it with complementary indicators can enhance reliability and reduce false signals. Below are some popular combinations and how they might work in practice.
1. DMI + RSI (Relative Strength Index)
The DMI focuses on trend direction and strength. The RSI zeroes in on momentum and potential overbought/oversold conditions.
If DMI signals a strong bullish trend (+DI > -DI, ADX rising), but RSI is nearing overbought territory (above 70), you might wait for a small pullback before entering a long trade.
Conversely, if the DMI indicates a strong bearish trend and RSI is oversold (below 30), you may hold off on new short entries until the RSI recovers somewhat, anticipating a short-term bounce.
2. DMI + Moving Averages
Moving Averages (MAs) are a staple in technical analysis, helping to identify the general direction of price over a specified period.
Use a 50-day or 200-day Simple Moving Average (SMA) to confirm the overall trend direction. If the price is above the SMA (bullish environment), and +DI is above -DI with a rising ADX, the alignment of these signals can provide high-conviction trades.
In a bearish scenario, if the price is trading below the SMA, -DI is above +DI, and ADX is strong, you have multiple confirmations of a downtrend.
3. DMI + Support/Resistance Levels
While DMI highlights trend strength and direction, horizontal support/resistance lines reflect key price levels where the market has historically reversed or paused.
Wait for a breakout above a well-defined resistance area that coincides with a bullish DMI crossover and rising ADX. This triple confluence often yields a strong move.
For a bearish setup, look for breakdowns below a critical support level with -DI above +DI and a rising ADX.
4. DMI + Volume Analysis
Volume is the lifeblood of price movement, confirming the strength behind any trend.
If +DI crosses above -DI and ADX is rising, strong volume spikes on upward price moves can validate that buying pressure is real.
If volume remains low despite an apparent DMI signal, the move may lack conviction and could fizzle quickly.
Common Mistakes to Avoid When Using This Indicator
While the Directional Movement Index is a valuable tool, it’s not without pitfalls—especially if you rely on it too heavily or misunderstand certain signals. Here are some common mistakes to watch out for:
1. Over-Reliance on DMI Alone
- Problem: Using just the DMI for every trading decision can be risky, as no single indicator can account for all market conditions.
- Solution: Confirm your findings with price action, candlestick patterns, or other indicators (e.g., RSI, Moving Averages).
2. Misinterpreting Low ADX Readings
- Problem: A low ADX reading often signals a non-trending or range-bound market. Traders who force trades in these conditions may face multiple whipsaws and small losses.
- Solution: Understand that a low ADX is generally a caution sign. You might opt to wait until the ADX rises above 20 or 25, or consider a range-trading strategy if you’re comfortable with that approach.
3. Ignoring Crossovers in Context
- Problem: While crossovers (i.e., +DI crossing above -DI) can be important, they can occur frequently in choppy markets, leading to potential false signals.
- Solution: Always check ADX alongside the crossover. A rising ADX can confirm the validity of the crossover, while a stagnant or declining ADX might signal a fake-out.
4. Failing to Adjust Timeframes or Periods
- Problem: The default 14-period setting for DMI calculations may not be optimal for every market or timeframe. In very volatile markets (such as certain cryptocurrencies), you might need to adjust these parameters.
- Solution: Test different periods (e.g., 10, 14, or 20) using demo accounts or backtesting tools to find what works best for your specific trading style.
5. Neglecting Fundamental or News Events
- Problem: Technical indicators do not capture sudden fundamental shifts, such as major earnings announcements, interest rate decisions, or geopolitical events.
- Solution: Always keep an eye on the economic calendar and news feeds. Even the strongest technical signals can fail if a shock event drastically shifts market sentiment.
6. Poor Risk Management
- Problem: No indicator can guarantee success if you don’t manage your risk. Over-leveraging or failing to set stop losses can wipe out your account even if most of your trades are winners.
- Solution: Incorporate robust risk management: set stop losses according to market volatility, size positions responsibly, and avoid risking more than a small percentage of your capital on any single trade.
Conclusion: Mastering This Tool for Profitable Trading
- The Directional Movement Index can be a game-changer when integrated properly into your trading approach. By helping you identify a trend's direction and strength, the DMI offers clarity and confidence—two critical elements for success in financial markets. Whether you’re a newcomer just learning the ropes or a seasoned trader looking to refine your strategy, this indicator provides actionable insights across various asset classes and timeframes. Remember to consider the following key points in your trading journey:
- Understand Each Component: ADX measures trend strength, while +DI and -DI pinpoint bullish or bearish pressure.
- Combine with Other Tools: Bolster your signals by pairing DMI with volume analysis, RSI, Moving Averages, or support/resistance levels.
- Practice and Backtest: Gain familiarity in a simulated environment before committing real capital.
- Adapt Your Settings: Don’t be afraid to experiment with different timeframes and periods for smoother or more responsive signals.
- Mind Market Context: Keep an eye on fundamental events and broader market sentiment to avoid being caught off guard.
Ultimately, consistent profitability requires a blend of the right indicators, sound risk management, and psychological discipline. The Directional Movement Index, with its proven track record and versatile applications, can serve as a cornerstone for anyone seeking to improve their technical analysis and enhance their trading strategies. By focusing on continuous learning, testing, and refinement, you’ll be well on your way to navigating the markets with greater precision and confidence.
Ready to put the Directional Movement Index to the test?
With TradeSearcher, you can instantly backtest trading strategies and identify the most profitable setups for any ticker. Start optimizing your trades today!