Table of Content
How to Succeed in EUR/USD Trading on TradingView: 3 Backtested Strategies Included
By Vincent Nguyen
Updated 533 days ago
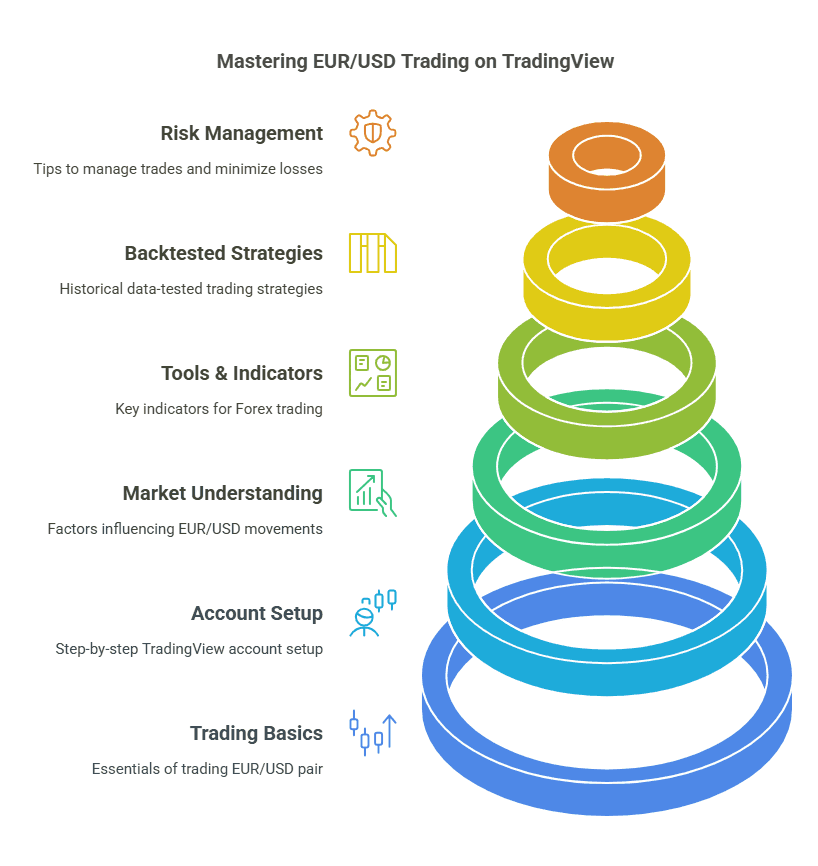
How to Trade EUR/USD on TradingView
Welcome to this comprehensive guide on EUR USD tradingview, where we’ll show you step-by-step how to trade the EUR/USD currency pair on TradingView, plus reveal three backtested strategies you can use to potentially improve your profitability.
In this article, you’ll learn:
Why EUR/USD is such an important currency pair for both novice and advanced traders.
How to set up your TradingView account for clear and effective chart analysis.
Key indicators and tools that can help you read the markets more accurately.
Three proven backtests, each with its own strategy, results, and recommendations.
Risk management tips and common trading pitfalls to avoid.
Let’s dive in!
Why Trade EUR/USD on EUR USD tradingview?
EUR/USD is the most heavily traded currency pair in the world, making it a popular choice for traders of all levels. When you combine its high liquidity and relatively stable price movements with the user-friendly interface of TradingView, you have a robust platform for analyzing trends and executing trades.
Key reasons to trade EUR/USD on EUR USD tradingview:
- High Liquidity: EUR/USD typically offers tight spreads, lowering your trading costs.
- 24-Hour Market: Forex markets are open around the clock on weekdays, giving you flexibility in your trading schedule.
- Powerful Tools: TradingView provides real-time price charts, technical indicators, and social features to enhance your analysis and decision-making process.
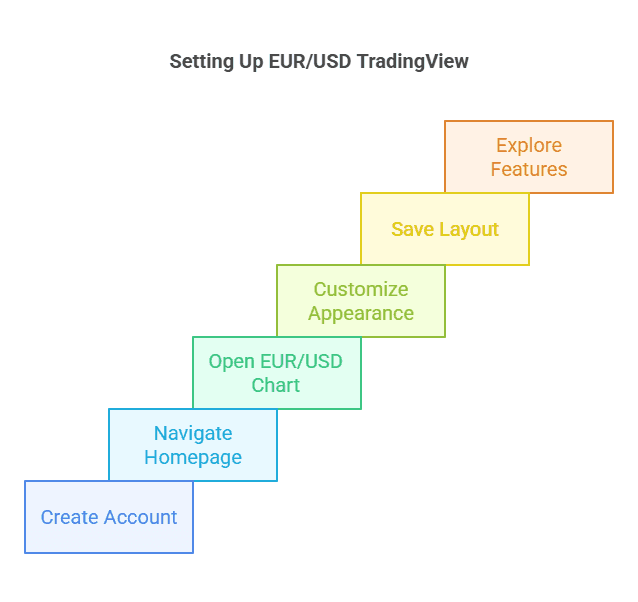
Setting Up Your EUR USD tradingview Account
Moving on to the practical side of getting started, let’s walk through the entire process of creating a TradingView account, configuring your workspace, and loading up the EUR/USD chart. By properly customizing your layout, you can streamline your future trading sessions and reduce the time it takes to analyze market conditions.
1. Creating an Account
- Visit TradingView.com: On the homepage, you’ll see an option to sign up. You can register with your email address or use a Google, Facebook, or Twitter account.
- Choose a Plan: While you can start for free and access most charting features, paid plans unlock extra benefits like more indicators per chart, additional saved chart layouts, and advanced alert types. If you’re new, the free plan is usually sufficient to explore the platform and practice basic trading strategies on EUR USD tradingview.
2. Navigating the Homepage
- Search Bar: Located at the top, it allows you to type in any ticker or symbol, including “EURUSD.” Once you select EURUSD from the search results (often labeled as “Forex” or “FX” data), you’ll be taken to the interactive chart.
- Watchlists: On the right-hand side, there’s a watchlist panel where you can add EUR/USD for quick access. This list lets you flip between different symbols rapidly, which is especially helpful if you plan to monitor multiple currency pairs in addition to EUR/USD.
3. Opening the EUR/USD Chart
- Chart Page: After selecting EURUSD, you’ll land on a dedicated chart page. If you’re new, the default chart might feel cluttered, but don’t worry—TradingView is highly customizable.
- Layout Options: On the upper toolbar, you can switch between “Light” and “Dark” themes, adjust the chart type (candlesticks, bars, lines), and modify the timeframe. Exploring each setting helps you find a visualization style that suits you best.
4. Customizing Chart Appearance
- Indicators and Tools: Near the top-left, you’ll see an “Indicators” button. Clicking on it reveals a massive library of built-in and community-created tools that you can apply to your EUR USD tradingview chart. Feel free to experiment with popular indicators like Moving Averages, RSI, and MACD first.
- Drawing Tools: The left toolbar usually contains icons for trendlines, Fibonacci retracements, and more. These tools allow you to annotate your charts, marking areas of support, resistance, or any pattern you spot (like triangles, channels, etc.).
- Grid and Background: Right-click on the chart, select “Settings,” and explore the “Appearance” tab. You can change colors for your grid, background, and candlesticks, making it visually appealing and easier on the eyes.
5. Saving Your Layout
- Save Button: Once you’ve arranged everything to your liking, click “Save” (usually a cloud icon) at the top. Choose a name for your layout, e.g., “EURUSD Default Setup.” This ensures you don’t lose your custom configurations.
- Autosave and Sync: TradingView offers autosave features that periodically back up your workspace. If you use TradingView on multiple devices, your saved layouts and watchlists can sync seamlessly when you log in.
6. Exploring Additional Features
Alerts: Setting price alerts on your EUR USD tradingview chart can be a game-changer. You’ll receive a notification (email, SMS, or in-app) whenever EUR/USD crosses a predetermined level. This helps you stay on top of market moves even when you’re not actively watching the screen.
Paper Trading: TradingView offers a built-in paper trading feature. You can practice placing trades with virtual money, perfect for beginners who want to test out strategies without risking real capital.
By following these steps, you’ll have a clean and efficient workspace tailored for trading EUR/USD. This straightforward setup process helps you focus on learning price action and technical analysis rather than wrestling with a complicated interface. Once you’ve got your account ready, it’s time to dig deeper into the fundamental forces and indicators that move EUR/USD.
Understanding the EUR/USD Pair
Grasping the fundamentals behind EUR/USD is crucial before diving into technical charts. While many traders focus primarily on patterns and indicators, having a solid understanding of what drives the Euro and the US Dollar can significantly improve your analytical skills. Below are key factors that influence this major currency pair.
1. Monetary Policy and Central Banks
European Central Bank (ECB): The ECB sets the monetary policy for the Eurozone. Changes in interest rates, quantitative easing programs, and economic outlooks announced by the ECB can have direct impacts on the Euro’s strength or weakness.
Federal Reserve (Fed): As the central bank of the United States, the Fed influences the US Dollar through policy decisions on interest rates, bond-buying programs, and forward guidance. Markets can move sharply when the Fed hints at future rate changes.
When analyzing EUR USD tradingview charts, keep an eye on announcements such as ECB press conferences or the Fed’s Federal Open Market Committee (FOMC) statements. Sudden volatility often follows these high-impact news releases.
2. Economic Indicators
- GDP Data: Gross Domestic Product (GDP) reports gauge economic growth. A better-than-expected GDP in the Eurozone or the US can strengthen the respective currency.
- Inflation (CPI): Central banks closely watch inflation levels when making rate decisions. Rising inflation might prompt the Fed or ECB to raise rates, which can attract capital flows into that currency.
- Employment Figures: Non-Farm Payrolls (NFP) in the US and similar reports in Europe can jolt EUR/USD prices.
- Consumer Sentiment: Indicators like the U. of Michigan Consumer Sentiment Index in the US or the Economic Sentiment Indicator in the Eurozone can sway market sentiment.
3. Political and Geopolitical Events
EUR/USD can be sensitive to political developments, such as elections, referendums, and geopolitical tensions involving the European Union or the United States. For instance, announcements regarding Brexit (though more directly related to the GBP) indirectly affect the Euro as well. Meanwhile, US political changes like presidential elections or trade policy shifts can alter market sentiment and currency flows.
4. Market Sentiment and Risk Appetite
Global risk sentiment also plays a role. In “risk-off” scenarios—where global investors are worried about economic downturns—traders often flock to perceived safe havens such as the US Dollar. Conversely, in a “risk-on” environment, the Euro might gain if investors feel confident about European markets’ growth prospects.
5. Combining Fundamentals and Technicals
While we’ll shortly delve into indicators and backtests on EUR USD tradingview, it’s beneficial to integrate fundamental data into your overall strategy. Even a simple approach of avoiding major economic news releases (if you’re uncomfortable with high volatility) can help you steer clear of sudden price spikes that might invalidate your technical setups.
Understanding these drivers not only gives you an edge in interpreting chart signals but also ensures you’re better prepared for potential volatility. In the next section, we’ll look at specific tools and indicators you can use on TradingView to blend these fundamental insights with technical analysis.
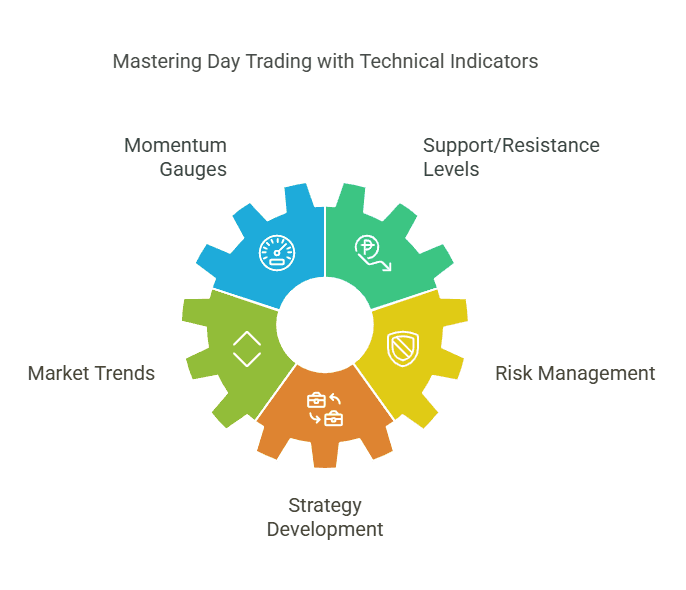
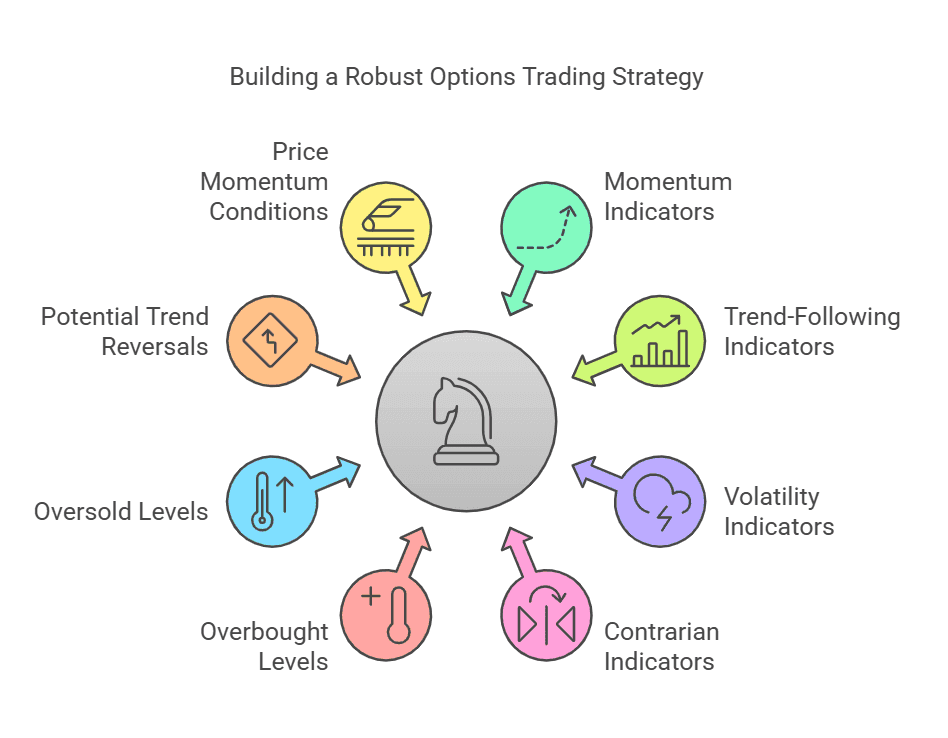
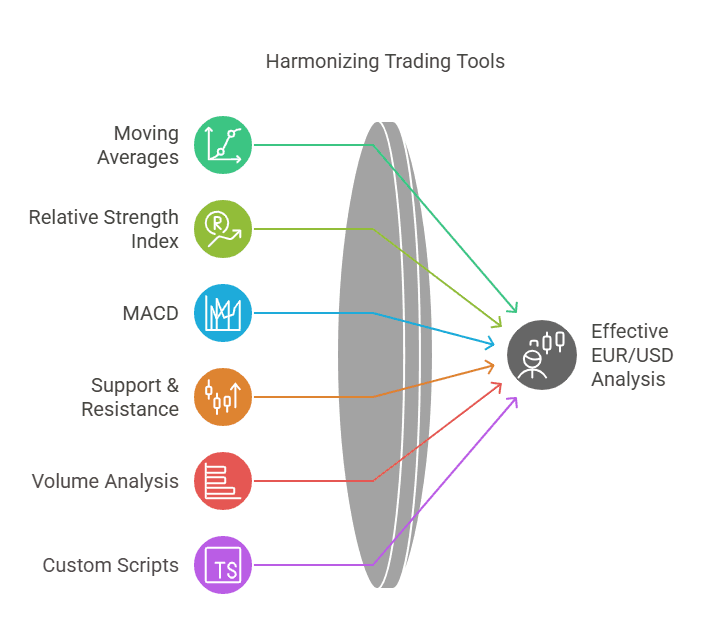
Essential Tools & Indicators on EUR USD tradingview
Technical analysis often feels like its own ecosystem, with indicators, oscillators, trend lines, and more. The good news is that TradingView accommodates nearly every tool you could imagine, making it a fantastic platform for analyzing EUR/USD. Below, we outline some essential indicators and techniques to get you started.
1. Moving Averages (MA)
Moving Averages are among the simplest yet most effective tools to gauge market direction on EUR USD tradingview.
- Simple Moving Average (SMA): Takes the arithmetic mean of price over a specified period. Common settings include 50-day and 200-day for identifying longer-term trends.
- Exponential Moving Average (EMA): Assigns more weight to recent price action, making it more responsive to sudden changes. Useful for short-term trend detection.
2. Relative Strength Index (RSI)
RSI oscillates between 0 and 100, measuring the speed and change of price movements.
- Overbought: RSI above 70 often indicates a potential downward correction.
- Oversold: RSI below 30 may signal an upward bounce.
- Divergence: RSI divergences (price making new highs while RSI doesn’t, or vice versa) can predict potential trend reversals on EUR USD tradingview.
3. MACD (Moving Average Convergence Divergence)
MACD displays the relationship between two EMAs and includes a histogram for visualizing momentum.
- Signal Line Crossover: When the MACD line crosses above the signal line, it’s often seen as a bullish signal.
- Zero Line Crossover: Moving from negative to positive territory indicates a shift in momentum from bearish to bullish—or the opposite when crossing downward.
3C MACD & RSI Scalper no repaint
3C MACD & RSI Scalper no repaint is tailored for active scalping, utilizing 1, 5, or 15-min TFs, with live tweaking for optimal performance across currency pairs. It leverages MACD peaks and RSI for entry points without repainting, and suggests long/short positions using different MA types and lengths. Session filtering, particularly the EU, enhances results. The strategy integrates with 3commas bots for execution but does not require a 3c subscription.
3C MACD & RSI Scalper no repaint
Plug Power, Inc. (PLUG)
@ 5 min
1.10
Risk Reward5.08 %
Total ROI153
Total Trades4. Drawing Tools for Support & Resistance
- Horizontal Lines: Easily mark levels where price has historically had difficulty breaking above (resistance) or below (support).
- Trendlines: Draw diagonal lines connecting higher lows in an uptrend or lower highs in a downtrend, helping you spot channel breakouts or triangle patterns.
- Fibonacci Retracement: This tool uses ratios derived from the Fibonacci sequence (23.6%, 38.2%, 50%, 61.8%, 78.6%) to anticipate potential reversal points during pullbacks.
5. Volume Analysis
While volume data for spot Forex can be tricky (since there’s no centralized exchange), TradingView does offer proxy volume metrics from brokers or futures data. Monitoring volume spikes can still provide insight into market participation and confirm breakouts or breakdowns on EUR/USD.
6. Custom Scripts and Indicators
One of TradingView’s standout features is its “Pine Script” language, which allows users to create custom indicators. You can explore the “Public Library” of scripts where the community shares specialized tools for analyzing EUR USD tradingview more effectively. For instance, you might find a custom pivot-point script or an advanced volatility indicator that suits your trading style.
7. Best Practices for Indicator Usage
- Less Is More: Resist the urge to overload your chart with too many indicators. Pick two or three that complement each other—one might measure momentum while another tracks trend direction.
- Multi-Timeframe Analysis: Check higher timeframes (e.g., daily or weekly) to see the bigger picture, then drill down to lower timeframes (e.g., 1H, 15M) to fine-tune entries and exits.
- Adapt Over Time: Market conditions change, so remain flexible. What works in a trending market might fail in a range-bound environment.
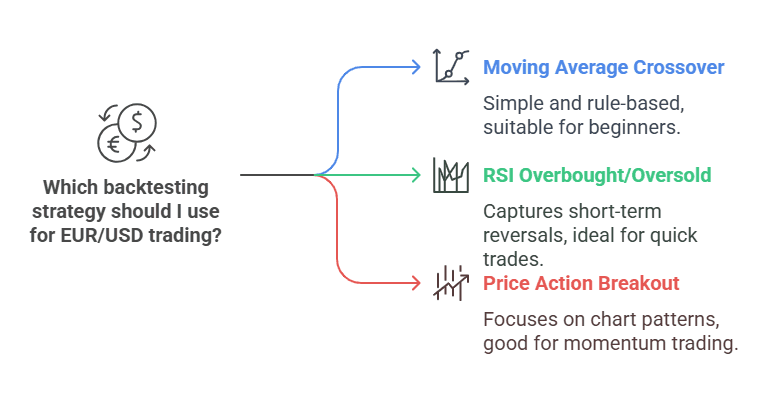
3 Backtests for Profitability on EUR USD tradingview
Backtesting is a powerful method for gauging how a strategy might have performed historically. While past performance doesn’t guarantee future results, a solid backtest can highlight strengths, weaknesses, and potential improvements. Below, we present three beginner-friendly strategies you can easily test on your EUR USD tradingview charts.
Backtest 1 – Simple Moving Average Crossover Strategy on EUR USD tradingview
The Moving Average Crossover is often the go-to for newcomers. It involves using two MAs, typically the 50-period and the 200-period. When the shorter MA crosses above the longer one, it’s a bullish signal; when it crosses below, it’s a bearish signal.
Entry & Exit Rules:
- Buy (Long) Entry: 50 MA crosses above the 200 MA.
- Sell (Short) Entry: 50 MA crosses below the 200 MA.
- Exit: Close the long position when a bearish crossover happens (shorter MA crosses below longer MA), and vice versa for short positions.
Historical Performance
A backtest over several years on the daily timeframe for EUR/USD often shows that while this strategy catches major trends, it can suffer in choppy or sideways markets. You may experience multiple small losses during range-bound periods, offset by a few large wins when a significant trend emerges.
Potential Improvements
- Add an Oscillator: Use RSI or Stochastics to avoid entering when the market is overextended, potentially filtering out some false signals.
- Use a Stop-Loss: Place stops just below recent swing lows (for a long trade) or above swing highs (for a short trade). This can limit drawdowns in volatile phases.
Moving Average Crossover Strategy
The Moving Average Crossover Strategy employs a combination of two simple moving averages and one exponential moving average to signal entry and exit points. Traders can customize which moving average crossings to use, with options to filter trades by conditions such as volume or RSI. Starting with a $100,000 account, it allocates 10% per trade to capitalize on these crossover signals.
Moving Average Crossover Strategy
QuantumScape Corporation (QS)
@ 5 min
1.00
Risk Reward1.49 %
Total ROI1329
Total TradesBacktest 2 – RSI Overbought/Oversold Strategy on EUR USD tradingview
This approach hinges on the principle that markets swing between overbought and oversold conditions. The RSI (14-period) is typically used, with levels set at 70 (overbought) and 30 (oversold).
Entry & Exit Rules:
- Buy (Long): If RSI dips below 30 and then moves back above 30, consider it a signal to go long.
- Sell (Short): If RSI crosses above 70 and then moves below 70, it might indicate an upcoming drop.
- Exit: An exit can be triggered when RSI returns to a neutral zone (e.g., close the trade once RSI hits 50) or crosses the opposite threshold.
Historical Performance
Testing this on the hourly or 4-hour chart for EUR/USD reveals that it can capture short-term reversals in range-bound markets. However, in strongly trending conditions, RSI can stay overbought or oversold for extended periods, leading to multiple false signals.
Potential Improvements
- Combine with Trend MAs: If the 50 MA is above the 200 MA, you might only take oversold RSI signals (long trades) because you’re trading in the direction of the primary trend.
- Tight Stop-Losses: In a fast-moving market, RSI signals can be overshadowed by momentum. Setting a stop-loss ensures you don’t hold onto a losing trade for too long.
Traders who prefer quick, counter-trend setups might appreciate this RSI-based system. Just remember that “the trend is your friend,” so it’s often wise to avoid contradicting a strong trend based on a single indicator.
Backtest 3 – Price Action Breakout Strategy on EUR USD tradingview
Price action trading focuses on chart patterns like triangles, wedges, or simply horizontal support and resistance. The breakout occurs when price bursts beyond these key levels, often sparking momentum-driven moves.
Entry & Exit Rules:
- Identify Levels: Pinpoint a clearly defined support or resistance area on your EUR USD tradingview chart.
- Confirm Breakout: Wait for a candle to close decisively above resistance (for a long entry) or below support (for a short entry).
- Stop-Loss and Take-Profit: Place your stop-loss just outside the breakout zone. A typical take-profit could be equal to the height of the pattern you identified (e.g., the height of a consolidation).
Historical Performance
Backtests on the 1-hour or 4-hour timeframe often show strong returns if the breakout is genuine and followed by increased volume or momentum. However, false breakouts are not uncommon, especially during low volume sessions or when market-moving news is imminent.
Potential Improvements
- Volume Confirmation: Use volume indicators to gauge whether a breakout is accompanied by higher-than-usual trading activity.
- Retests: Some traders prefer waiting for a retest of the broken level before entering a trade, thereby reducing the likelihood of being caught in a fake-out.
This strategy appeals to traders who are comfortable analyzing pure price action and prefer not to rely heavily on indicators. It can offer substantial risk-to-reward ratios if you time your entries well and are strict about stop-loss placement.
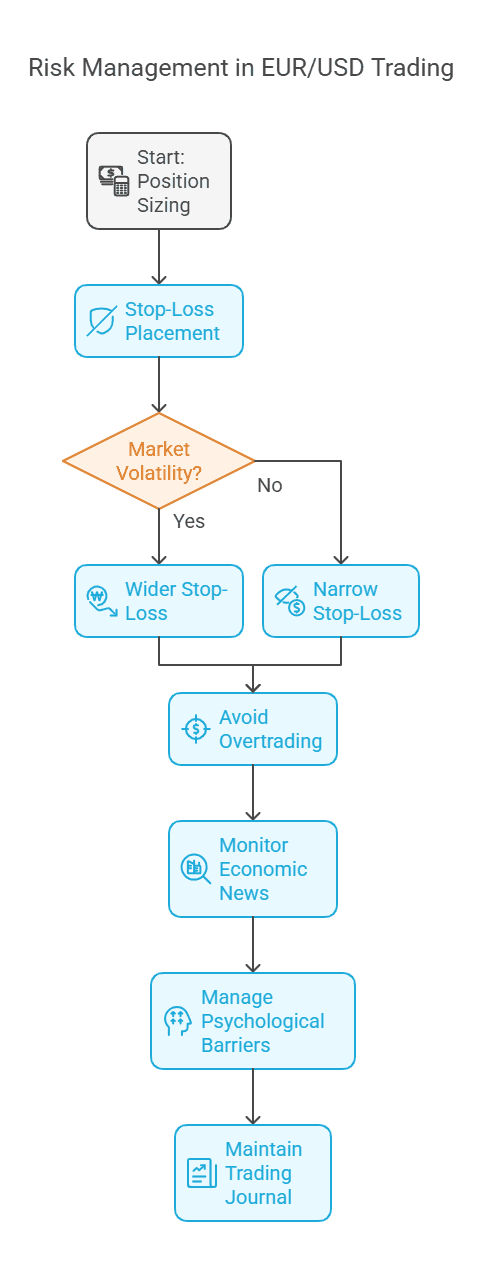
Risk Management & Common Pitfalls When Using EUR USD tradingview
No strategy is bulletproof, and even the most promising setups can fail under certain conditions. That’s why risk management is the cornerstone of successful trading. Below are essential practices to consider when using EUR USD tradingview for real or demo trading.
1. Position Sizing
One of the most overlooked aspects of trading is how much to risk per trade. A common rule of thumb is to risk only 1-2% of your total account balance on any single position. By keeping risk small, you ensure that a few losing trades won’t wipe out your capital.
2. Stop-Loss Placement
A stop-loss is a predetermined exit point for a trade that moves against you. When placing stop-losses:
- Technical Placement: Position your stop behind a key support/resistance level or a recent swing high/low.
- Volatility Considerations: In a volatile market, you might set a wider stop-loss and reduce your position size to maintain the same overall risk.
3. Avoid Overtrading
It’s tempting to jump into the market each time the price wiggles, but too many trades can rack up fees and emotional exhaustion. Instead, focus on high-probability setups that align with your strategy. Patience often differentiates successful traders from those who burn out.
4. Ignoring Economic News
Given how sensitive EUR/USD is to events like Fed rate decisions, ECB statements, and economic data releases, ignoring the calendar can be costly. Even the best technical setup might fail if a major surprise news item disrupts the market. Keep an eye on events by integrating an economic calendar into your daily routine.
5. Psychological Barriers
- Fear and Greed: Fear can keep you out of good trades, and greed can make you overstay in losing positions or increase your position size recklessly.
- Revenge Trading: After a loss, it’s common to want to “make it back” quickly. This emotional reaction often leads to bigger losses.
- Lack of Discipline: Failing to follow your system’s entry and exit rules can quickly turn a potentially profitable strategy into a losing one.
6. Record Keeping
A trading journal is invaluable. Note down:
- Date and Time: When you entered and exited trades.
- Strategy Used: The rationale behind each trade, including technical and fundamental factors.
- Outcome: Profit, loss, or break-even, along with lessons learned.
Reviewing your journal helps you identify patterns in your decision-making, both good and bad. Over time, you’ll refine your approach, discarding elements that don’t work and honing those that do.
By incorporating these risk management principles, you safeguard your trading capital and maintain a level head, even when the markets get choppy. The final piece of the puzzle is to wrap up our journey with EUR USD tradingview, emphasizing how you can pull everything together—technical tools, fundamentals, risk management—to maximize your chances of long-term success.
Conclusion – Maximizing Results on EUR USD tradingview
EUR USD tradingview offers an excellent platform for new and experienced traders to analyze and trade the EUR/USD currency pair. By setting up a clear chart layout, using reliable indicators, and performing thorough backtests, you can build confidence in your strategies. Remember to use proper risk management, stay updated on economic news, and keep refining your approach over time.
Try these steps, strategies, and backtests on EUR USD tradingview with a demo account before committing real capital. With consistent practice and a disciplined mindset, you’ll be better equipped to navigate the Forex markets and potentially profit from EUR/USD price movements.
Ready to supercharge your trading strategy?
With TradeSearcher, you can instantly backtest and optimize strategies for EUR/USD and other assets. Sign up today and take your trading to the next level with real-time insights and data-driven results!