Table of Content
How to Learn PineScript: 10 Strategy Examples & Beginner’s Guide
By Vincent Nguyen
Updated 534 days ago
How to Learn PineScript
PineScript is an incredibly powerful scripting language that lives within the TradingView platform, offering traders a convenient way to design custom indicators, automate trading strategies, and test technical analysis ideas directly from their browser.
Whether you’re a seasoned trader or just starting your journey in coding, PineScript provides an accessible entry point into algorithmic trading and technical strategy development.
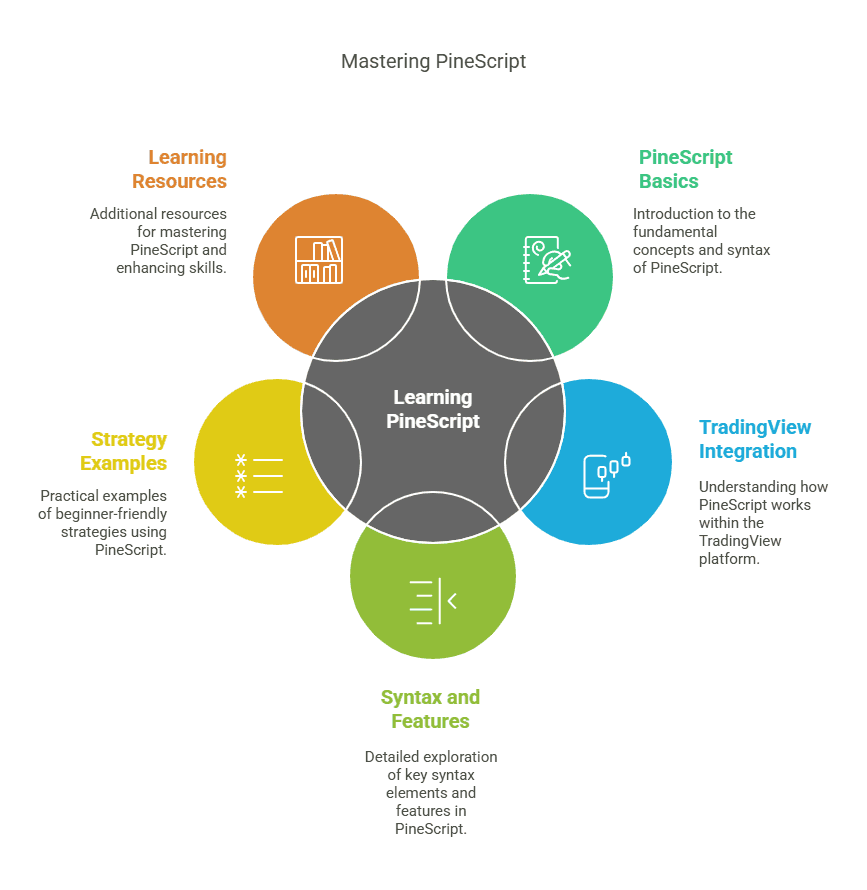
In this comprehensive guide, we’ll explore everything you need to know to learn PineScript from the ground up, explain how it integrates with TradingView, walk you through key syntax and features, present 10 beginner-friendly PineScript strategy examples, and direct you to valuable learning resources.
By the end of this article, you will have a strong foundation in PineScript, enabling you to confidently create custom indicators, test trading strategies, and streamline your technical analysis workflow.
Understanding PineScript Basics
PineScript is the dedicated programming language for TradingView, one of the most popular charting platforms among retail traders, analysts, and financial bloggers. This language was designed with user-friendliness in mind, reducing the learning curve typically associated with more complex coding languages like Python, C++, or Java. PineScript is intentionally minimalistic yet sufficiently robust for crafting powerful custom trading tools.
1. The Origins of PineScript
- Simplicity at Its Core: PineScript was developed to allow everyday traders to convert their ideas and analyses into functional scripts without mastering a large-scale programming language.
- Integration with TradingView: Because PineScript is native to TradingView, there is no need for external software, compilers, or environments. You simply log in, open the Pine Editor, and start coding.
2. How PineScript Differs from Other Languages
- Single-Purpose Design: While Python or C++ can be used for a wide array of applications, PineScript is specifically optimized for creating and testing trading indicators and strategies directly on TradingView charts.
- Code-on-Chart: PineScript scripts run on TradingView’s servers, allowing you to visualize outputs plots, signals, alerts right on your price chart without wrestling with external integrations.
3. Core Concepts: Indicators vs. Strategies
- ndicators (study()): PineScript indicators primarily display lines, shapes, oscillators, or signals on the chart. Indicators do not execute trades; they offer insights to guide your decisions.
- Strategies (strategy()): PineScript strategies go a step further by including trade entry and exit commands, which enables backtesting and forward-testing of trading rules. This means you can see hypothetical profits/losses on the chart directly.
4. Why PineScript is User-Friendly
- Short Syntax: PineScript code is concise. Even complex strategies rarely exceed a few hundred lines.
- Extensive Documentation: TradingView provides a thorough reference for every function, making it easy to learn PineScript by example.
- Active Community: Thousands of publicly available scripts can be studied, copied, and modified, accelerating the learning process.
Why It’s Essential for TradingView
TradingView is a web-based charting platform known for its extensive library of technical indicators, ease of use, and vibrant social community. While it already includes a comprehensive set of default indicators and drawing tools, PineScript opens the door to limitless customization. Here’s why PineScript is so important for TradingView users:
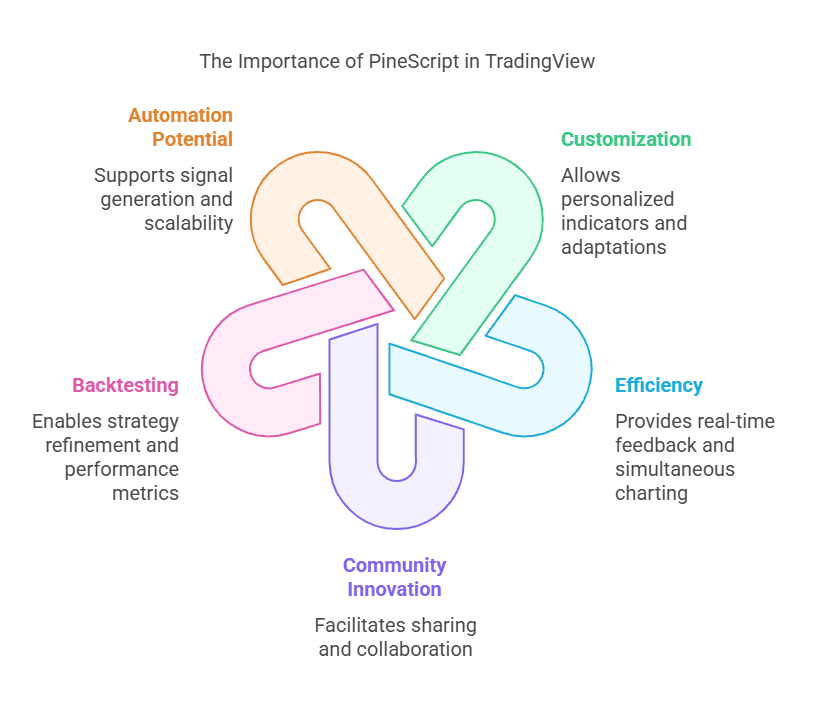
- Personalized Analysis: With PineScript, you can implement your own rules, calculations, and unique chart visuals. For example, you might develop a specialized volume-based oscillator that isn’t available in standard indicator libraries.
- Adaptation of Existing Scripts: Have a favorite indicator that needs a slight tweak? PineScript allows you to fork the code from the TradingView Public Library, adjust parameters, and add your personal touch.
- Instant Feedback: PineScript scripts update in real time as you edit them. Type your logic, click “Add to chart,” and see immediate results.
- Simultaneous Charting: TradingView handles the heavy lifting on the server side, so your local machine isn’t bogged down by complex calculations.
- Public Library: TradingView hosts a massive collection of user-submitted scripts that anyone can explore. From unique oscillators to creative bar color overlays, you’ll find countless PineScript examples to study.
- Collaboration and Sharing: You can publish your PineScript code publicly, allowing others to comment, use, and even improve upon your ideas. This social aspect accelerates learning and fosters innovation.
- Strategy Mode: By switching from an indicator (study()) to a strategy(), you can create automated trading rules. TradingView then runs a historical backtest on the chart to show how your rules performed.
- Data-Rich Analytics: PineScript strategies can generate detailed performance metrics—profit factor, drawdown, number of trades—giving you quantifiable insights into a strategy’s viability.
- Automation Potential: While PineScript itself doesn’t directly place trades on live brokerage accounts, it can generate signals and alerts. With TradingView’s alert system or third-party bridge tools, you can connect those signals to your broker’s API for semi-automated or fully automated trading.
- Scalability: PineScript’s minimal overhead and seamless integration with TradingView means that even if you’re dealing with multiple scripts or multiple markets, the workflow remains straightforward.
Setting Up Your Environment
Before you start writing PineScript, it’s essential to get comfortable with TradingView’s interface and the Pine Editor. You can begin coding even on a free TradingView account.
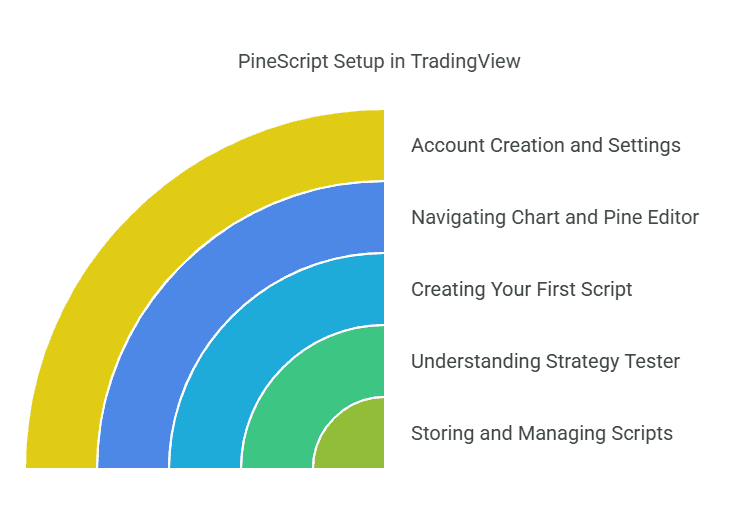
Create or Log Into Your TradingView Account
- Account Plans: TradingView offers free and paid plans (Pro, Pro+, Premium). Most PineScript features are accessible on the free tier, though saved chart layouts are limited.
- User Settings: Update your profile and security settings for a stable coding environment.
Navigating the Chart and Pine Editor
- Open a Chart: Select any financial instrument (e.g., stocks, crypto, forex) from TradingView’s homepage.
- Locate the Pine Editor: Scroll to the bottom of the interface to find the “Pine Editor” tab. Click it to open the editor.
- Familiarize Yourself: The editor includes line numbers, syntax highlighting, and an error console for debugging.
Creating Your First Script
- Click “New”: Generate a script template with version declaration using the “New” button in the editor.
- Add to Chart: Write or paste your code and click “Add to Chart.” Errors will be displayed in the console if the script fails.
Understanding the Strategy Tester Panel
- Strategy Performance: Attaching a strategy shows metrics like net profit, drawdown, and trade history in the “Strategy Tester” tab.
- Historical Data: Backtesting uses chart data. You can switch timeframes or symbols to see how your strategy performs.
Storing and Managing Scripts
- Saving Scripts: Click “Save” to store your code in TradingView’s cloud for access across devices.
- Organizing Work: Use clear names and version numbers to keep your scripts easily searchable.
Core PineScript Syntax and Features
PineScript syntax is designed to be approachable, even for traders with limited coding background. Although you’ll discover many advanced features as you progress, grasping the basics will enable you to write and understand a wide variety of scripts. Below are key PineScript syntax essentials and features you’ll rely on most often.
Version Declaration
Each iteration of PineScript introduces new functions, changes, and improvements. By declaring a version at the start of your code (e.g., //@version=5), you ensure your script runs under the correct ruleset.
Example:
//@version=5indicator("My First Indicator", shorttitle="MFI")PineScript 4 and PineScript 5 are commonly used. PineScript 5 introduced more robust functionality, so it’s generally recommended for new scripts.
Script Type: Indicator or Strategy
- indicator(): Used to build custom indicators that visually represent calculations on a chart. Indicators typically plot lines, shapes, or background colors.
- strategy(): Used for rules-based systems that can simulate trade entries and exits. This is essential for backtesting and verifying how a set of conditions might perform historically.
Variables and Data Structures
You can define floats, integers, booleans, or strings. For example:
myVar = 10myBool = falsemyString = "Hello PineScript"PineScript supports arrays for more advanced data manipulation, but be mindful of the performance impact if used extensively.
Functions and Control Flow
PineScript comes loaded with built-ins like ema(source, length), sma(source, length), rsi(source, length), and many more.
Use if / else statements to control your logic. For instance:
if close > open // do somethingelse // do something elsePineScript v5 allows for loops, but they are typically used for array operations, not iterating through historical bars (since PineScript processes data bar-by-bar automatically).
Plotting
- plot(): The most common way to visualize data on the chart. For instance:
emaValue = ema(close, 20)plot(emaValue, color=color.blue, linewidth=2)- plotshape(): Draws symbols like arrows or circles on the chart. It’s helpful for highlighting signals.
- plotchar(): Renders ASCII characters on the chart. Often used to mark events.
Strategy-Specific Functions
- strategy.entry(): Enters a long or short position when conditions are met.
- strategy.exit(): Closes positions, sets stop-loss or take-profit levels.
In a strategy script, ensure your logic references data from the current or previous bar properly. Repainting issues arise if you inadvertently reference future bars or real-time data incorrectly.
Reusability and Organization
- PineScript supports user-defined functions (e.g., f_myFunction()) for code reusability.
- Variables can be declared as var (initialized only once) or redefined on every bar. This allows for stateful logic, such as counters or accumulators.
Alerts and Automation
In PineScript, you can use alertcondition() to define the logic that triggers an alert in TradingView.
While PineScript itself doesn’t place live trades, TradingView alerts can be integrated with webhooks or third-party apps (e.g., AutoView, various bridging solutions) to automate trade execution.
10 PineScript Strategy Examples for Beginners
Now that you have a grasp on the essentials of PineScript, let’s put that knowledge into practice. Below are 10 PineScript strategy examples ranging from simple indicators to slightly more advanced concepts. Each strategy showcases different facets of PineScript, such as built-in functions, conditionals, and plotting techniques. Keep in mind these are educational examples rather than guaranteed profit-making systems—always perform thorough testing and risk management.
1) PineScript MACD Crossover Strategy
The Moving Average Convergence Divergence (MACD) strategy revolves around spotting bullish or bearish momentum shifts when the MACD line crosses above or below its signal line. This approach attempts to catch trend reversals or continuations.
Key PineScript Elements
- Use macd() or custom MACD calculation.
- Trigger strategy.entry() on crossover(macdLine, signalLine) and crossunder(macdLine, signalLine).
Example Sketch
//@version=5strategy("MACD Crossover", overlay=false)fastLength = input.int(12, "Fast EMA Length")slowLength = input.int(26, "Slow EMA Length")signalLength = input.int(9, "Signal SMA Length")macdValue = ta.macd(close, fastLength, slowLength, signalLength)macdLine = macdValue[0]signalLine = macdValue[1]if ta.crossover(macdLine, signalLine) strategy.entry("MACD Long", strategy.long)if ta.crossunder(macdLine, signalLine) strategy.entry("MACD Short", strategy.short)2) RSI Overbought/Oversold
The Relative Strength Index (RSI) measures price momentum. Traders often look to buy when RSI falls below a certain threshold (e.g., 30) and sell when it rises above another (e.g., 70).
Implementation Steps
- Calculate RSI using ta.rsi(close, 14) (14 is a common default period).
- Issue a long entry if RSI < 30, and a short entry if RSI > 70.
- Modify levels or time periods to suit your style.
Example Sketch
//@version=5strategy("RSI Overbought/Oversold", overlay=false)rsiLength = input.int(14, "RSI Length")rsiOB = input.int(70, "Overbought Level")rsiOS = input.int(30, "Oversold Level")rsiVal = ta.rsi(close, rsiLength)if rsiVal < rsiOS strategy.entry("RSI Long", strategy.long) if rsiVal > rsiOB strategy.entry("RSI Short", strategy.short)3) PineScript Moving Average Crossover
Moving Average crossovers are a classic strategy signal. Here, two moving averages (e.g., 50-day and 200-day) are compared. A bullish crossover occurs when the shorter MA crosses above the longer MA.
PineScript Highlight
- Typically uses ta.ema() or ta.sma().
- Enter long on crossover(shortMA, longMA), exit or reverse on crossunder(shortMA, longMA).
Example Sketch
//@version=5strategy("Moving Average Crossover", overlay=true)shortLength = input.int(50, "Short MA Length")longLength = input.int(200, "Long MA Length")shortMA = ta.ema(close, shortLength)longMA = ta.ema(close, longLength)plot(shortMA, color=color.yellow, linewidth=2)plot(longMA, color=color.red, linewidth=2)if ta.crossover(shortMA, longMA) strategy.entry("MA Long", strategy.long)if ta.crossunder(shortMA, longMA) strategy.entry("MA Short", strategy.short)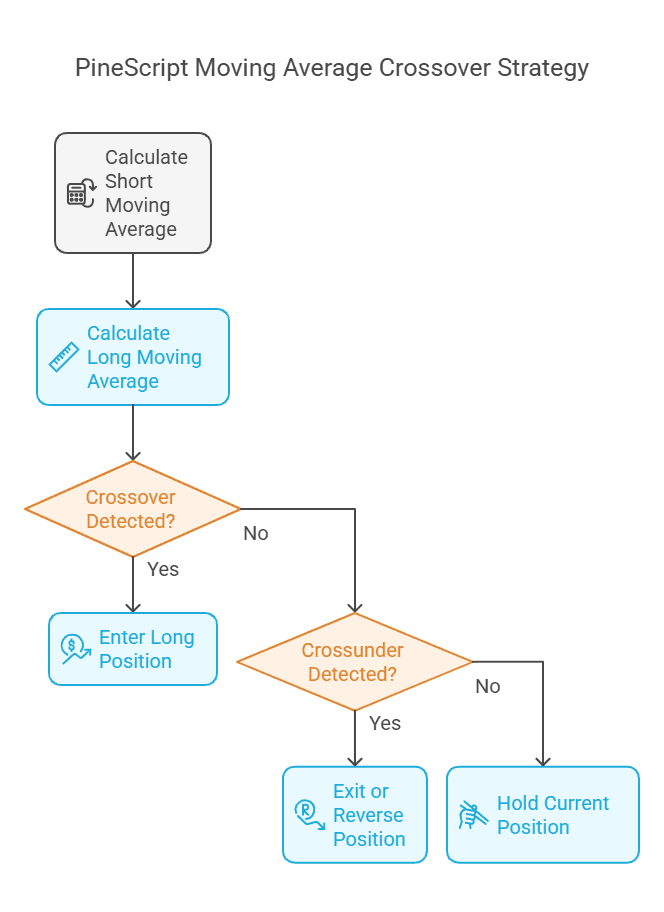
Bollinger Bands Breakout Strategy
The Bollinger Bands Breakout Strategy signals a long position when the price closes above the upper band, and a short position when it closes below the lower band. Solely relying on the bands for entry, this approach does not consider volume, RSI, or fundamentals. It performs best with price continuation following a band breach. While suitable for trend spotting on Heikin Ashi candles, real-time prices should be used for entries. Settings are adjustable, and studying Bollinger's rules is recommended for effectiveness.
Bollinger Bands Breakout Strategy
BONK / TetherUS (BONKUSDT)
@ 2 h
1.06
Risk Reward368.43 %
Total ROI193
Total Trades4) Bollinger Bands Breakout
Bollinger Bands measure volatility by placing upper and lower bands around a moving average. A Bollinger Band breakout strategy might buy when the price closes above the upper band (anticipating volatility expansion) and sell when it closes below the lower band.
Implementation Details
- Use ta.bb() or manually calculate a middle line (SMA) plus/minus a standard deviation factor.
- Entry signals occur when price crosses the band boundaries, but additional filters are often needed to avoid false breakouts.
Example Sketch
//@version=5strategy("Bollinger Bands Breakout", overlay=true)length = input.int(20, "BB Length")mult = input.float(2.0, "Std Dev Multiplier")basis = ta.sma(close, length)dev = mult * ta.stdev(close, length)upperBand = basis + devlowerBand = basis - devplot(basis, color=color.white)plot(upperBand, color=color.green)plot(lowerBand, color=color.red)if close > upperBand strategy.entry("BB Long", strategy.long)if close < lowerBand strategy.entry("BB Short", strategy.short)Adjust length and mult based on the asset’s volatility profile for better tuning.
5) PineScript Stochastic Oscillator Approach
The Stochastic Oscillator compares a closing price to a price range over a given period, indicating potential overbought or oversold conditions. A typical approach might go long when the Stoch line dips below 20 and then crosses back above it, anticipating a momentum shift.
How It Works in PineScript
- Compute the Stochastic %K line with ta.stoch().
- Use thresholds (20, 80) to define oversold/overbought.
- crossover() and crossunder() can confirm turning points.
Example Sketch
//@version=5strategy("Stochastic Oscillator Strategy", overlay=false)kLength = input.int(14, "K Length")dLength = input.int(3, "D Smoothing")smooth = input.int(3, "Stoch Smoothing")kValue = ta.stoch(high, low, close, kLength)dValue = ta.sma(kValue, dLength)stochK = ta.sma(kValue, smooth)if ta.crossover(stochK, dValue) and stochK < 20 strategy.entry("Stoch Long", strategy.long)if ta.crossunder(stochK, dValue) and stochK > 80 strategy.entry("Stoch Short", strategy.short)Using both %K and %D lines in your conditions can refine entries, reducing false signals.
6) PineScript Heikin Ashi Trend Filter
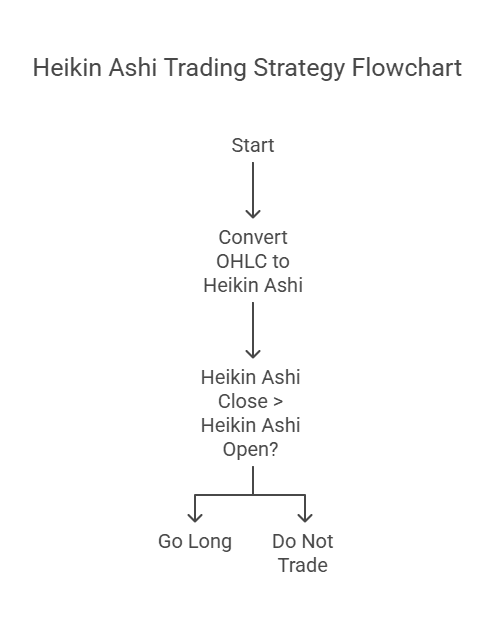
Heikin Ashi candles are a modified form of candlesticks that smooth out noise, potentially highlighting clearer trends. By computing Heikin Ashi values in PineScript, you can filter trades to align with the broader trend direction.
Key Steps
- Convert standard OHLC data to Heikin Ashi format (haOpen, haClose, haHigh, haLow).
- Trade only in the direction of the Heikin Ashi trend. For instance, go long if Heikin Ashi close is consistently above Heikin Ashi open.
Example Sketch
//@version=5
strategy("Heikin Ashi Trend Filter", overlay=true)
// Calculate Heikin Ashi
haClose = (open + high + low + close) / 4
haOpen = na(haOpen[1]) ? (open + close)/2 : (haOpen[1] + haClose[1]) / 2
haHigh = math.max(high, math.max(haClose, haOpen))
haLow = math.min(low, math.min(haClose, haOpen))
plot(haClose, color=color.blue, linewidth=2)
longCondition = haClose > haOpen
shortCondition = haClose < haOpen
if longCondition
strategy.entry("HA Long", strategy.long)
if shortCondition
strategy.entry("HA Short", strategy.short)
7) Donchian Channel Technique
A Donchian Channel plots the highest high and lowest low over a specified lookback period, capturing price breakouts beyond recent ranges. Trend traders often enter on new highs and exit on new lows (or vice versa for short trades).
Implementation
- Use ta.highest() and ta.lowest() to calculate the channels.
- If price crosses above the upper channel, that may be a bullish signal; crossing below the lower channel may be bearish.
Example Sketch
//@version=5strategy("Donchian Channel Strategy", overlay=true)length = input.int(20, "Donchian Length")donchianUpper = ta.highest(high, length)donchianLower = ta.lowest(low, length)plot(donchianUpper, color=color.green, linewidth=2)plot(donchianLower, color=color.red, linewidth=2)if close > donchianUpper strategy.entry("Donchian Long", strategy.long)if close < donchianLower strategy.entry("Donchian Short", strategy.short)Adjusting the length can drastically alter the frequency of signals. A shorter length is more reactive, while a longer length avoids whipsaws but might lag major moves.
8) PineScript Hull Moving Average Setup
The Hull Moving Average (HMA) aims to reduce lag compared to traditional moving averages. It does so through a calculation that incorporates weighted moving averages, making it highly responsive to recent price changes.
Hull MA Calculation Steps
- Calculate a Weighted Moving Average (WMA) of price data.
- Incorporate a second WMA of half the period.
- Combine and take the WMA again with the square root of the period for smoothing.
Example Sketch
//@version=5strategy("Hull MA Strategy", overlay=true)length = input.int(21, "HMA Length")hullMA(src, length) => halfLength = math.round(length / 2) sqrtLength = math.round(math.sqrt(length)) wma1 = ta.wma(src, length) wma2 = ta.wma(src, halfLength) hull = 2 * wma2 - wma1 ta.wma(hull, sqrtLength)hullValue = hullMA(close, length)plot(hullValue, color=color.purple, linewidth=2)if close > hullValue strategy.entry("HMA Long", strategy.long)if close < hullValue strategy.entry("HMA Short", strategy.short)While the above logic is simplistic (price vs. HMA crossover), you can refine it with additional conditions or smoothing filters.
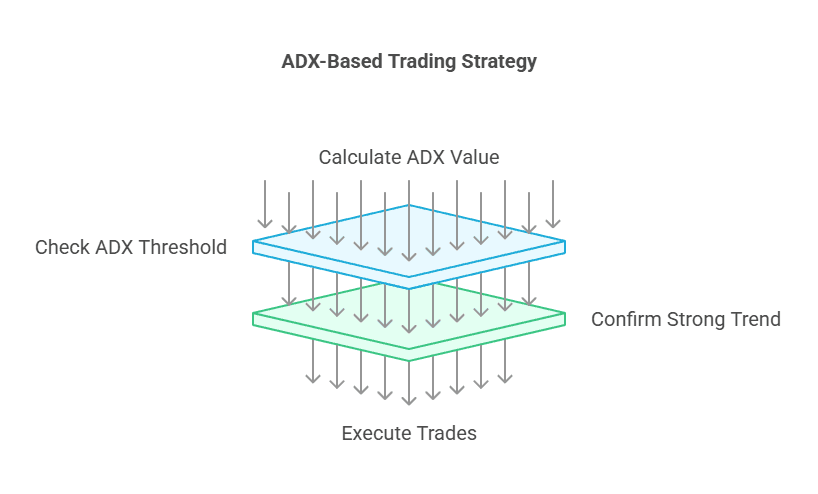
9) ADX Trend Strength Example
The Average Directional Index (ADX) measures the strength of a trend. An ADX above 20 or 25 often indicates a trending market. You can combine ADX with other indicators (e.g., moving averages) to confirm trend entries.
PineScript Implementation
- Use ta.adx(dmiLength) to get the ADX value.
- Trade only if ADX is above a threshold, implying a strong trend.
Example Sketch
//@version=5strategy("ADX Trend Strategy", overlay=false)dmiLength = input.int(14, "DMI Length")threshold = input.int(25, "ADX Threshold")adxValue = ta.adx(dmiLength)trendIsStrong = adxValue > threshold// For simplicity, combine with a moving average crossovershortMA = ta.sma(close, 20)longMA = ta.sma(close, 50)if ta.crossover(shortMA, longMA) and trendIsStrong strategy.entry("ADX Long", strategy.long)if ta.crossunder(shortMA, longMA) and trendIsStrong strategy.entry("ADX Short", strategy.short)You may reduce whipsaws during sideways markets by insisting on a strong trend (via ADX).
10) PineScript Ichimoku Cloud Analysis
Ichimoku Cloud is a multifaceted indicator comprising multiple lines—Tenkan-sen, Kijun-sen, Senkou Span A, Senkou Span B, and Chikou Span. It provides a holistic view of support/resistance, trend direction, and momentum.
Implementation Notes
- Compute Tenkan-sen (conversion line) and Kijun-sen (base line) from lookback periods.
- The “cloud” is formed by Senkou Span A and Senkou Span B, projecting into the future.
- Basic bullish signals occur when price is above the cloud, Tenkan-sen is above Kijun-sen, and the cloud is bullishly oriented.
Example Sketch
//@version=5strategy("Ichimoku Cloud Strategy", overlay=true)conversionLength = input.int(9, "Tenkan-sen")baseLength = input.int(26, "Kijun-sen")laggingSpan2Length = input.int(52, "Senkou Span B")conversionLine = (ta.highest(high, conversionLength) + ta.lowest(low, conversionLength)) / 2baseLine = (ta.highest(high, baseLength) + ta.lowest(low, baseLength)) / 2spanA = (conversionLine + baseLine) / 2spanB = (ta.highest(high, laggingSpan2Length) + ta.lowest(low, laggingSpan2Length)) / 2plot(conversionLine, color=color.blue)plot(baseLine, color=color.red)plot(spanA, color=color.new(color.green, 0))plot(spanB, color=color.new(color.maroon, 0))// Basic Bullish Conditionif (close > spanA and close > spanB) and (conversionLine > baseLine) strategy.entry("Ichimoku Long", strategy.long) // Basic Bearish Conditionif (close < spanA and close < spanB) and (conversionLine < baseLine) strategy.entry("Ichimoku Short", strategy.short)Traders often apply additional filters (like the Chikou Span cross) to refine entries. Ichimoku can be complex, but PineScript simplifies the coding by providing straightforward functions for highest/highest-based calculations.
Conclusion: Your Next Steps with PineScript
PineScript is a transformative tool that empowers you to develop, customize, and backtest trading indicators and strategies directly within TradingView. By starting with the basics—understanding version declarations, script structures, and fundamental functions—you can quickly move on to more advanced concepts like multi-timeframe analysis, complex filters, and alert-driven automation.
Keep in mind that each market behaves differently, so thorough testing and sensible risk management are essential steps when applying any new PineScript strategy in real-world trading.
Now that you’ve seen how PineScript can be used in 10 practical examples—ranging from MACD crossovers to Ichimoku Cloud analysis—you have a robust foundation to build upon. Use the official PineScript documentation to deepen your knowledge, explore the TradingView community for inspiration, and gradually refine your coding techniques by tackling new challenges.
The scope of PineScript extends beyond mere indicators; with enough creativity and practice, you can design complete trading ecosystems that reflect your personal market philosophies. By continuing to learn PineScript, you’ll unlock powerful ways to tailor TradingView to your unique trading objectives—ultimately boosting both your efficiency and insight in the ever-evolving markets.
Ready to elevate your trading game?
Discover winning strategies faster with TradeSearcher.ai—your AI-powered tool for finding, analyzing, and optimizing the best trading strategies. Explore over 100,000 backtests and start making smarter trades today!
Sign up at TradeSearcher.ai and leverage AI-driven insights to stay ahead of the market!
You'll also like

Reading about strategies is step one
Answer a few questions and get matched with backtested strategies that fit your style.