Table of Content
How to Use Python for Algorithmic Trading: Beginner’s Guide with Tools and Libraries
By Vincent Nguyen
Updated 549 days ago
How to use Python for Algorithmic trading
How to use Python for Algorithmic trading is one of the most frequent questions asked by aspiring quantitative traders seeking a smooth entry into automated trading. The ability to code trading strategies, backtest them on historical data, and eventually deploy them to live markets has drawn many finance enthusiasts and computer programmers to Python.
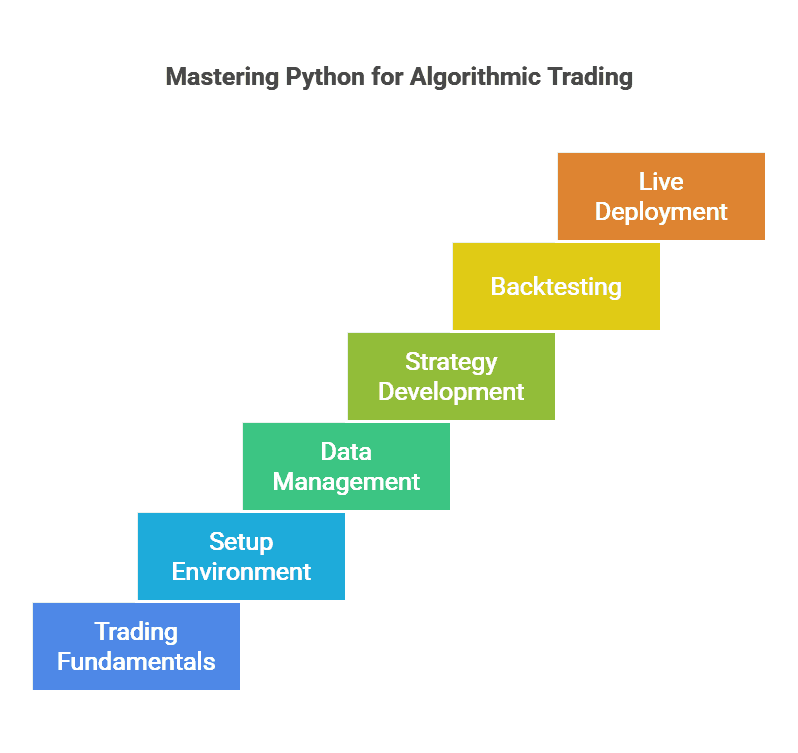
This guide will walk you through the entire journey, from understanding the fundamentals of algorithmic trading to setting up a proper Python environment, exploring the best open-source libraries, and learning how to handle data, backtesting, and live deployment. By the end, you will have a solid foundation and a clear roadmap for how to use Python for Algorithmic trading with confidence.
How to use Python for Algorithmic trading: Understanding Algorithmic Trading Fundamentals
Algorithmic trading refers to the automated execution of trades based on a predefined set of rules or models. Instead of manually clicking “buy” or “sell” in a brokerage account, an algorithm (often called a “bot” or “algo”) automatically analyzes market data and places trades when certain criteria are met. Many large financial institutions and hedge funds have leveraged algorithmic strategies for decades, but recent technological advancements and open-source tools have made it accessible to individual traders as well.
Below are the key concepts behind algorithmic trading and why Python is the language of choice for so many:
1. Speed and Efficiency
- Automated systems can instantly react to real-time market data.
- Reduces delays associated with manual order placement.
2. Systematic Approach
- Trades are executed based on objective rules, minimizing emotional or impulsive decisions.
- Strategies can be tested thoroughly on historical data before going live.
Data-Intensive Analysis
- Algorithmic trading thrives on analyzing large datasets (e.g., historical prices, fundamentals, alternative data).
- Python’s extensive data manipulation libraries simplify the ingestion and processing of huge data streams.
Why Python?
- Easy to Learn and Write: Python’s syntax is clean and readable, making it suitable for beginners.
- Vast Ecosystem: Libraries like pandas, NumPy, scikit-learn, and many more support all aspects of algorithmic trading.
- Community Support: Python has an active community where developers continuously share code, resources, and solutions to common problems.
How to use Python for Algorithmic trading: Setting Up Your Development Environment
A solid development environment is a crucial first step in your algorithmic trading journey. You need a reliable setup that lets you install libraries, test code, and keep dependencies organized. Let’s walk through the major steps: installing Python, choosing an IDE, and managing virtual environments.
How to use Python for Algorithmic trading: Installing Python and IDEs
When learning how to use Python for Algorithmic trading, the first tool you need is Python itself. You can download Python for free from the official website. Most traders today use Python 3.x, as Python 2.x reached the end of its life in 2020.
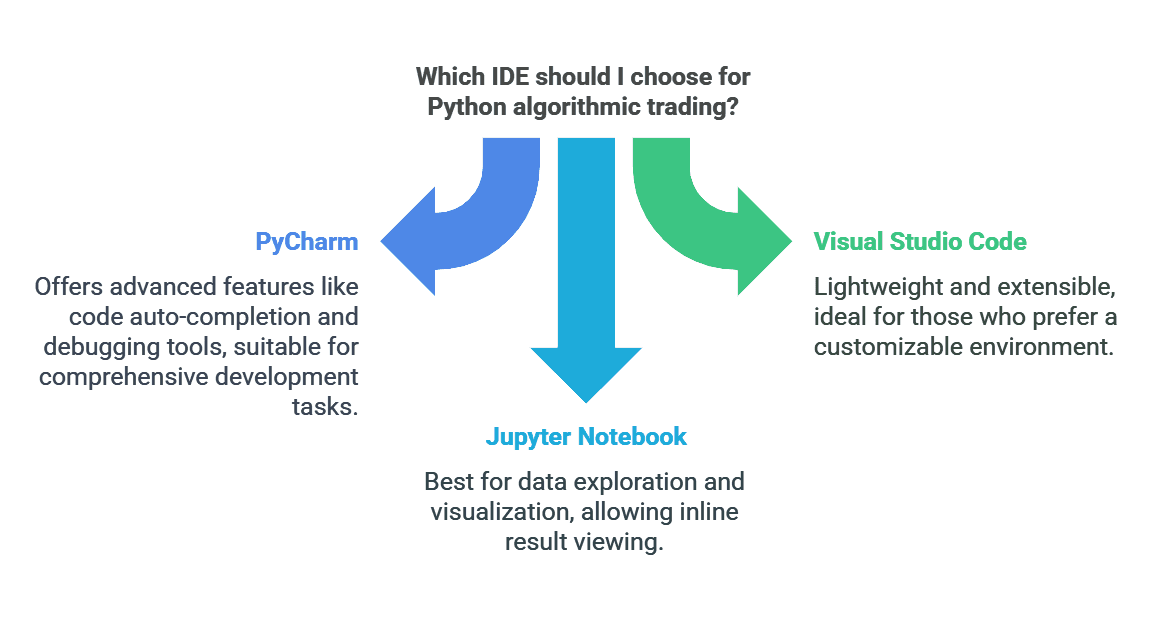
Next, choose an Integrated Development Environment (IDE) or code editor that suits your workflow. Popular options include:
- PyCharm: Offers advanced features like code auto-completion, debugging tools, and integrated version control.
- Visual Studio Code (VS Code): Lightweight, extensible, and supported by a wide range of plugins.
- Jupyter Notebook: Great for data exploration and visualization, as it allows you to see results inline.
Any of these IDEs can handle the core tasks of algorithmic trading in Python downloading data, running backtests, and displaying performance charts.
Creating Virtual Environments
When you install libraries for trading—such as pandas for data manipulation or matplotlib for plotting you want to ensure that different projects do not conflict with each other’s dependencies. Virtual environments help isolate project-specific libraries and versions.
You can use the built-in venv module:
# Create a new environment
python -m venv algo-trading-env
# Activate the environment (on Windows)
algo-trading-env\Scripts\activate
# Activate the environment (on macOS/Linux)
source algo-trading-env/bin/activate
# Install libraries within this virtual environment
pip install pandas numpy matplotlib
Alternatively, you can use Conda (from Anaconda) to create and manage virtual environments. By keeping each project’s dependencies contained, you avoid compatibility issues that can derail your algorithmic trading applications.
How to use Python for Algorithmic trading: Data Acquisition and Management
At the heart of every algorithmic strategy is data, lots of it. Learning how to use Python for Algorithmic trading involves effectively fetching, cleaning, and storing market data. This section covers the basics, from free APIs to database management.
Online APIs and Datasets
There are numerous data providers offering real-time and historical market data. Some popular options:
- Alpha Vantage: Provides free stock APIs (limited calls per minute).
- Yahoo Finance: Used to be popular for free historical data; can still be accessed via Python packages like yfinance.
- Quandl: Hosts a wide array of financial, economic, and alternative data sources, both free and premium.
- Polygon.io or Finnhub: Known for real-time feeds and wide asset coverage.
A simple example using yfinance to fetch historical data for Apple (AAPL) might look like this:
import yfinance as yf
ticker_data = yf.download('AAPL', start='2020-01-01', end='2021-01-01')
print(ticker_data.head())
Within seconds, you have a DataFrame containing daily Open, High, Low, Close, and Volume. You can then resample or manipulate it using libraries like pandas.
Local Database Management
As you progress, you’ll likely accumulate large volumes of historical data. Hosting this data locally gives you faster access and the ability to store more data than many free APIs allow.
- SQLite: A lightweight, file-based database ideal for smaller projects or single-user scenarios.
- PostgreSQL: Powerful, open-source relational database that can handle large-scale trading data.
- MySQL: Another popular open-source database option with widespread community support.
By pairing these databases with Python ORMs (Object Relational Mappers) like SQLAlchemy, you can query data efficiently. This means you can load only the segments of data you need for backtesting or modeling, rather than loading massive CSV files every time.
How to use Python for Algorithmic trading with Essential Python Libraries
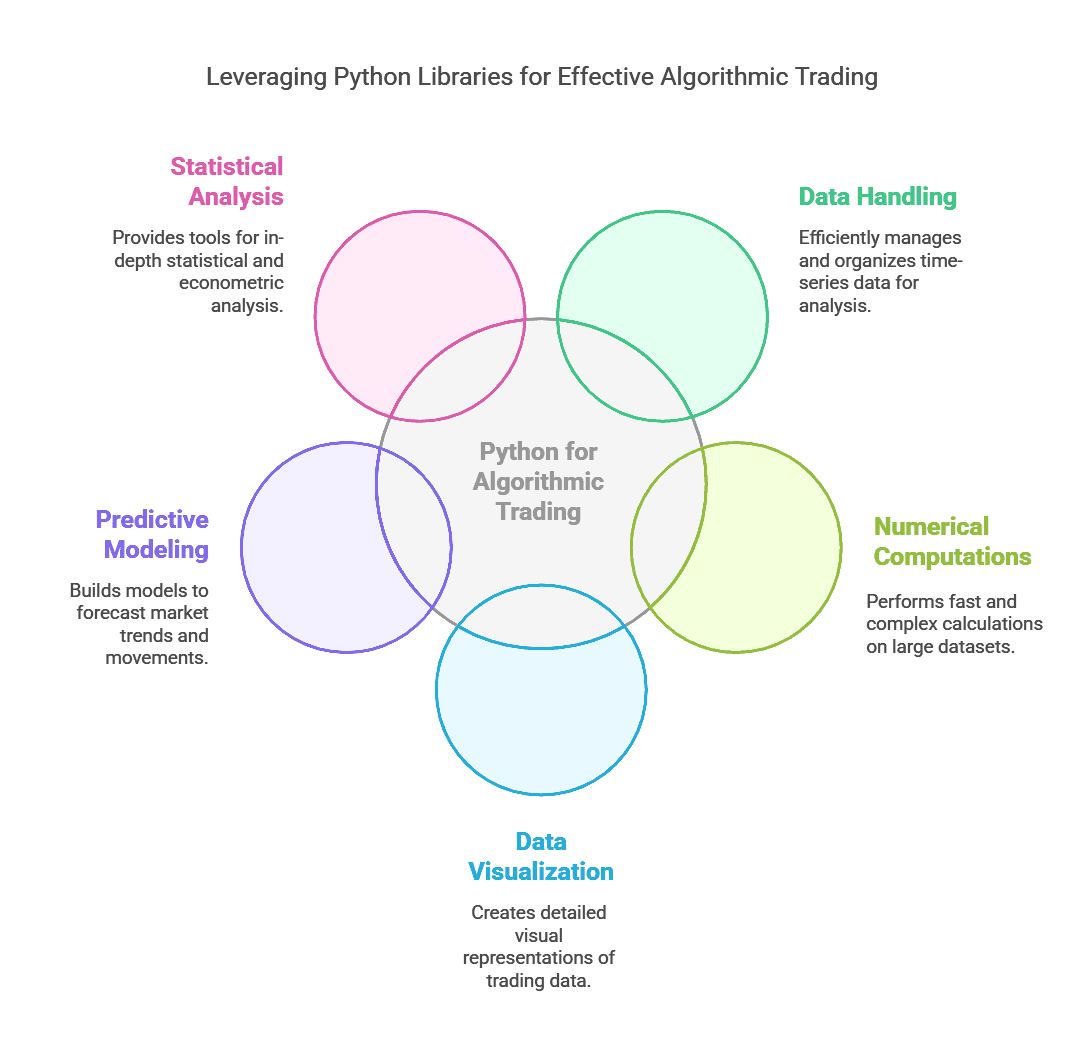
To fully leverage how to use Python for Algorithmic trading, you must be aware of the critical libraries that simplify data manipulation, calculations, and visualizations.
1. pandas
- Ideal for handling time-series data with its DataFrame structure.
- Offers resampling, rolling window calculations, and easy data cleaning.
2. NumPy
- Provides fast vectorized operations, enabling complex numerical computations on large arrays.
3. Matplotlib / Plotly
- Enables detailed data visualization. You can plot price charts, candlestick charts, and other performance metrics.
4. scikit-learn
- A go-to machine learning library for Python.
- Useful for building predictive models, from simple regressions to advanced deep learning frameworks (in combination with libraries like TensorFlow or PyTorch).
5. statsmodels
- Offers advanced statistical tools, including regression modeling, time-series analysis, and econometric methods.
Mastering these libraries is key to becoming proficient in how to use Python for Algorithmic trading. They streamline tasks like cleaning data, building indicators, and performing complex numerical analyses all of which are cornerstones of a robust trading strategy.
How to use Python for Algorithmic trading: Strategy Development
Once your environment is set up and you can comfortably retrieve and store data, the next step is turning trading ideas into fully coded algorithms. Strategy development involves several critical steps, from defining which assets you’ll trade to specifying entry and exit signals.
Defining Your Trading Universe
One essential aspect of how to use Python for Algorithmic trading is deciding which securities to include in your strategy. This list of securities is known as your “trading universe.”
Key considerations:
- Liquidity: Ensure that each asset is sufficiently liquid, meaning high trading volume and tight bid-ask spreads.
- Volatility: Some strategies thrive on volatility, while others require stable price movements.
- Data Availability: If you’re missing data or it’s incomplete, it’s risky to include that asset in the strategy.
To specify your trading universe in Python, you might create a list or dictionary of ticker symbols. For instance:
# Example of a stock universe
stock_universe = ['AAPL', 'MSFT', 'GOOG', 'AMZN', 'TSLA']
How to use Python for Algorithmic trading: Creating a Trading Algorithm
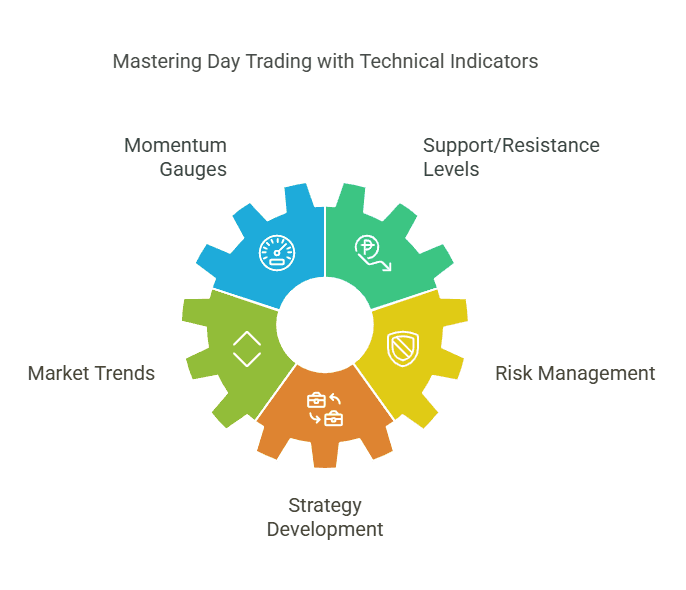
Creating the rules for your trading algorithm is where financial domain knowledge merges with coding. You’ll typically define a set of indicators, such as moving averages or momentum oscillators, and then specify when to “buy” or “sell” based on those indicators.
For example, a simple Moving Average Crossover strategy might look like this:
- Calculate a short-term moving average (e.g., 50-day) and a long-term moving average (e.g., 200-day).
- If the short-term average crosses above the long-term, go long (buy).
- If the short-term average crosses below the long-term, go flat or short (sell/exit).
In Python using pandas, you can compute these moving averages like so:
import pandas as pd
# Assuming 'df' is a DataFrame containing a 'Close' column
df['MA_Short'] = df['Close'].rolling(window=50).mean()
df['MA_Long'] = df['Close'].rolling(window=200).mean()
# Generate signals
df['Signal'] = 0
df.loc[df['MA_Short'] > df['MA_Long'], 'Signal'] = 1
df.loc[df['MA_Short'] < df['MA_Long'], 'Signal'] = -1
Here, Signal can be interpreted as the trading action: 1 for a long position, -1 for a short position, and 0 for neutral. You can refine or combine signals from multiple indicators to shape more sophisticated strategies. At this stage, remember to document every detail of your logic. Clarity is crucial for later troubleshooting and optimization.
How to use Python for Algorithmic trading: Backtesting and Optimization
Before deploying any strategy to the live market, traders should test it on historical data to see how it might have performed. This process is called “backtesting.” Thorough backtesting helps identify if your strategy stands a good chance of success or if it’s likely to fail due to overfitting or flawed assumptions.
Backtesting with Libraries like Backtrader
When learning how to use Python for Algorithmic trading, one of the most popular frameworks you’ll encounter is Backtrader. It simplifies the entire backtesting process:
- Load your historical data (e.g., CSV files, Pandas DataFrames).
- Define your strategy (entry/exit rules).
- Instantiate a “Cerebro” engine, add data feeds and strategy objects, and run the backtest.
- Examine performance metrics such as total return, drawdowns, and the Sharpe ratio.
A minimal Backtrader snippet looks like this:
import backtrader as bt
class MyStrategy(bt.Strategy):
def __init__(self):
self.ma_short = bt.ind.SMA(period=50)
self.ma_long = bt.ind.SMA(period=200)
def next(self):
if self.ma_short[0] > self.ma_long[0]:
self.buy()
elif self.ma_short[0] < self.ma_long[0]:
self.close()
cerebro = bt.Cerebro()
data = bt.feeds.YahooFinanceData(dataname='AAPL', fromdate=datetime(2020,1,1), todate=datetime(2021,1,1))
cerebro.adddata(data)
cerebro.addstrategy(MyStrategy)
cerebro.run()
cerebro.plot()
You then receive a detailed output of how the strategy performed over the specified time range. Such insights help you refine strategies before risking actual capital.
Optimization Techniques
Optimization involves systematically adjusting your strategy’s parameters (e.g., the length of a moving average) to find the best combination for historical data. You might test dozens or hundreds of variations. However, a major pitfall is overfitting—tuning your strategy too precisely to past data, resulting in poor real-world performance.
Best practices:
- Walk-Forward Analysis: Partition your historical data into multiple segments for sequential testing and retraining.
- Cross-Validation: Randomly shuffle the dataset into training and test sets, repeatedly validating on different segments.
- Out-of-Sample Testing: Reserve a recent chunk of data to test the final strategy, which was not used during the optimization process.
By following these techniques, you can gain more confidence that your strategy will generalize to future market conditions.
How to use Python for Algorithmic trading: Live Deployment
Transitioning from a backtested model to the live market is one of the most crucial steps in learning how to use Python for Algorithmic trading. Real-world constraints like slippage, latency, and brokerage fees can dramatically impact your results.
How to use Python for Algorithmic trading: Paper Trading
Paper trading (also known as “demo trading” or “virtual trading”) simulates live market conditions but without risking real money. It’s an excellent way to validate that your strategy’s logic works under real-time data and that orders are placed correctly.
Some brokers and services that support Python-based paper trading:
- Interactive Brokers via the IB API
- Alpaca (a commission-free platform supporting equities)
- OANDA (popular for forex)
For example, Alpaca provides a Python SDK (alpaca-trade-api) that lets you stream live price data into your Python script. You can place simulated buy and sell orders, track PnL (Profit and Loss), and refine your algorithm if you encounter unexpected issues—like incorrectly triggered signals.
How to use Python for Algorithmic trading: Real-Money Implementation
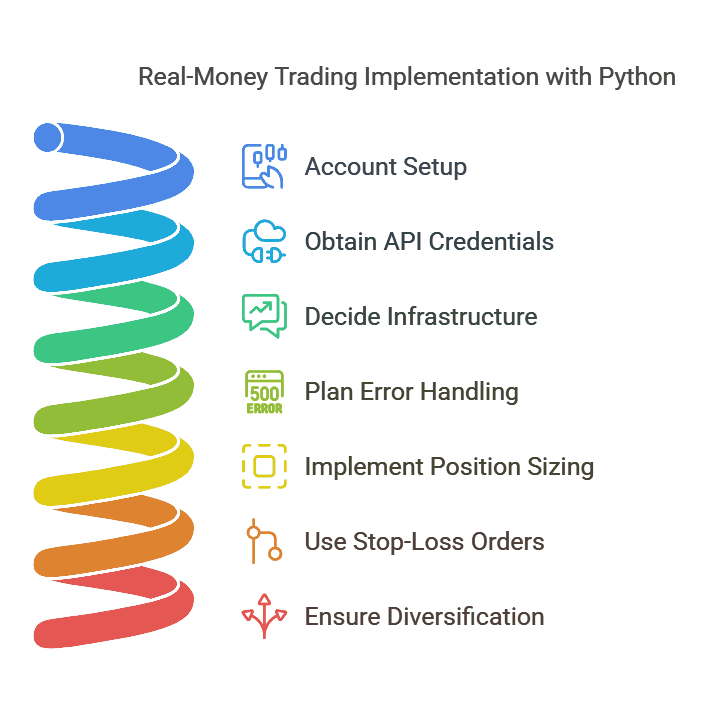
Once your strategy has passed both backtesting and paper trading, you might decide to allocate real capital. To do this, you’ll typically connect your Python application to a brokerage API:
- Account Setup: Ensure you have the correct account types (e.g., margin or cash, portfolio margin, etc.).
- Brokerage API Credentials: Obtain an API key and secret token to authenticate your Python application.
- Infrastructure: Decide whether to run your trading bot on a local machine or cloud servers (e.g., AWS, Google Cloud).
- Error Handling: Plan for connectivity issues, server downtime, or order rejections. Proper exception handling in your code is crucial.
Real-money trading also brings in an elevated need for risk management:
- Position Sizing: Use position sizing rules that limit the portion of your account allocated to each trade.
- Stop-Loss Orders: Automatically exit a position if it moves against you by a specific threshold.
- Diversification: Reduce portfolio-level risk by trading multiple assets or strategies.
How to use Python for Algorithmic trading: Top Open-Source Projects and Tools
The Python ecosystem is filled with open-source frameworks and tools that can jumpstart your journey into algorithmic trading. Here are some standouts and how they fit into the broader workflow.
1. Backtrader
- Comprehensive backtesting and live trading support.
- Wide range of built-in indicators and analyzers.
2. Zipline (Quantopian’s open-source legacy)
- Once the backbone of the now-defunct Quantopian platform.
- Offers a pipeline for data ingestion, strategy development, and performance analysis.
3. rqalpha
- Popular in Asia, especially in China, for quantitative research and multiple broker integrations.
- Active community and documentation in both English and Chinese.
4. TA-Lib
- Focuses on technical analysis indicators.
- Covers everything from basic moving averages to advanced oscillators.
5. PyAlgoTrade
- Lightweight backtesting library focused on simplicity and extensibility.
- Supports both stock and cryptocurrency data.
6. freqtrade
- Tailored to the crypto markets, supporting multiple exchanges.
- Includes built-in risk management tools, strategy templates, and a helpful user community.
These projects not only speed up your development but also serve as valuable learning resources. You can study how they structure their code, manage data, and implement trading logic—adapting their best practices into your own scripts.
How to use Python for Algorithmic trading: Common Mistakes and Best Practices
In your quest to figure out how to use Python for Algorithmic trading, you’ll likely make mistakes. This is normal and can be a highly educational part of the process. Below are some common pitfalls and guidelines on how to avoid them.
Common Pitfalls
Overfitting
Over-optimizing parameters to historical data leads to lackluster performance in live markets.
Survivorship Bias
Using data only from stocks that exist today overlooks delisted or bankrupt companies.
Ignoring Transaction Costs
Commissions, fees, and slippage can turn a profitable backtest into a losing reality.
Poor Data Quality
Inaccuracies in historical data can produce misleading backtest results.
Neglecting Risk Management
Focusing solely on returns without addressing drawdowns can lead to catastrophic losses.
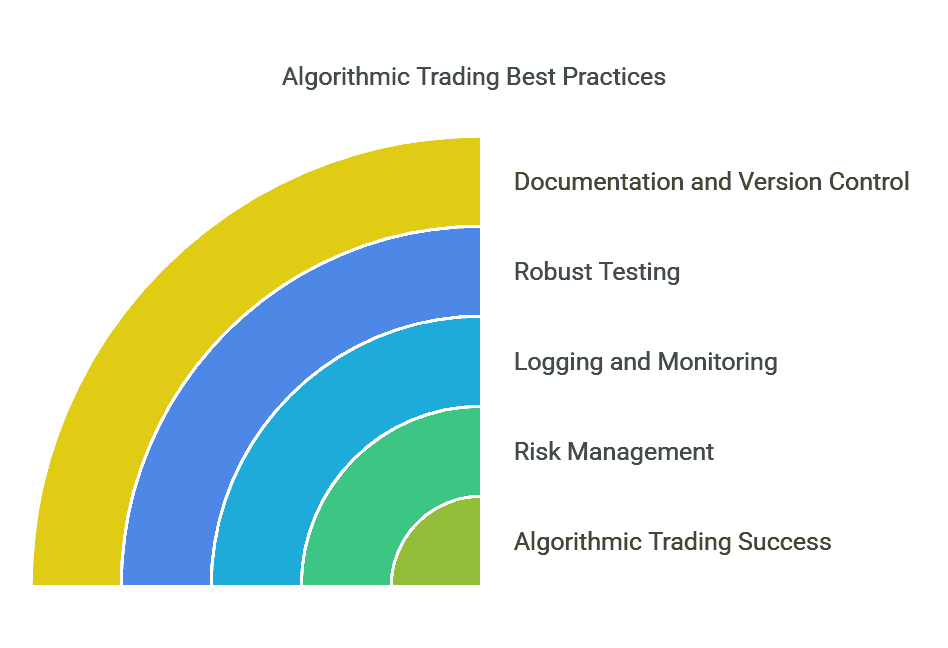
Best Practices
Version Control
- Use Git (and GitHub or GitLab) to track changes in your code. This makes it easier to revert to earlier versions if a new change breaks your system.
Documentation
- Write docstrings and maintain a technical journal. Future you or collaborators will appreciate clear explanations of each step.
Robust Testing
- Combine multiple testing approaches (in-sample, out-of-sample, walk-forward).
- Paper trade strategies before risking real money.
Logging and Monitoring
- Integrate logging libraries (e.g., logging in Python) to record each trade and system event for troubleshooting.
- Monitor performance metrics (PnL, drawdown) in real-time.
Risk Management
- Always cap the maximum risk per trade.
- Diversify across different markets or timeframes to reduce portfolio risk.
By acknowledging these pitfalls early on and adhering to best practices, you can avoid major financial and technological disasters, ensuring a smoother path in learning how to use Python for Algorithmic trading.
How to use Python for Algorithmic trading: Conclusion
In conclusion, How to use Python for Algorithmic trading starts by mastering the essentials of data acquisition, environment setup, and coding best practices all underpinned by a disciplined approach to risk and strategy design. Python’s robust ecosystem of libraries and open-source tools empowers you to rapidly transition from a simple trading idea to a fully automated system ready for backtesting and potential live deployment. Remember to continually refine your approach, stay aware of evolving market conditions, and build a strong foundation in data science and statistics. By following the principles outlined here, you’ll be well on your way to success in How to use Python for Algorithmic trading and beyond.
Looking for reliable resources to kickstart your algorithmic trading journey?
TradeSearcher is here to guide you with the latest strategies, tools, and market insights!
You'll also like

Reading about strategies is step one
Answer a few questions and get matched with backtested strategies that fit your style.