Table of Content
RSI + SMA Crossover Strategy: Beginner-Friendly Guide to Maximize ROI
By Vincent Nguyen
Updated 554 days ago
Why the RSI + SMA Crossover Strategy Reduces False Signals
RSI + SMA Crossover Strategy is a powerful trading strategy that appeals to both beginners and experienced traders. This strategy combines two versatile indicators—Relative Strength Index (RSI) and Simple Moving Average (SMA)—to uncover potential market reversals with minimal False signals. You can use it to spot momentum shifts and price movement across different financial markets. By learning the basics and applying these momentum indicators properly, you can improve your trading performance while controlling downside risk.
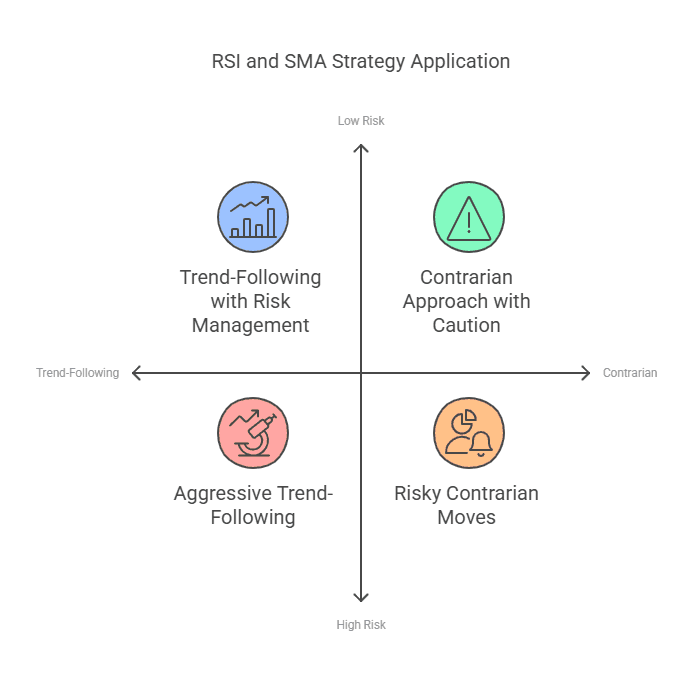
In this guide, you will explore the mechanics of the RSI + SMA Crossover Strategy, how to interpret various crossover signals, and why it can serve as both a trend-following and contrarian approach. You will also learn how to manage elevated risk, use multiple time frames, and avoid overbought condition or oversold condition traps. By following this strategy’s Trading Rules, you can gain valuable insights into short-term and long-term trends.
Let’s begin with a closer look at how the RSI and SMA work together to generate trade signal confirmations.
D-BoT Alpha 'Short' SMA and RSI Strategy
The D-BoT Alpha 'Short' SMA and RSI Strategy involves initiating a short position when the RSI crosses over 51 and the closing price is below the 200-period SMA. This strategy signals an exit when the closing price exceeds the trailing stop, the RSI moves beyond 54, or drops below the take-profit level of 32. Strengths include its dual indicator use and incorporation of a trailing stop to manage risks. Drawbacks are its simplicity and lack of consideration for trading costs and broader market factors.
D-BoT Alpha 'Short' SMA and RSI Strategy
AMC Entertainment Holdings, Inc. (AMC)
@ 5 min
1.05
Risk Reward5.72 %
Total ROI484
Total TradesRSI + SMA Crossover Strategy: Understanding the Basics
RSI and SMA are momentum indicators often used to determine short-term and long-term trends. They help traders identify periods of overbought condition or oversold condition in asset price movements. When these two indicators align, it often provides a reliable trade signal.
1. Relative Strength Index (RSI) in Focus
The RSI is a versatile indicator that measures average gains and losses over a specified Time frame.
Standard parameter settings for RSI often use 14 periods, but you can adjust the average periods based on your trading style.
RSI values above 70 can signify an overbought condition, while readings below 30 imply an oversold condition.
RSI sometimes forms bullish divergence or bearish divergence. These can serve as early warnings of potential market reversals.
2. Simple Moving Average (SMA) Explained
The SMA calculates the average price of an asset over a certain number of bars or candles (e.g., 50-day).Buy Signal often occurs when the price crosses above the SMA. Conversely, a sell signal may arise when the price crosses below.
Shorter SMA periods (e.g., 10 or 20) react more quickly to price fluctuation. Longer SMAs (50, 100, or 200) filter out choppy price action and show the larger trend.
A golden cross happens when a short-term SMA crosses above a long-term SMA, indicating a bullish signal. A dead cross, on the other hand, suggests a potential downward trend.
3. How the Crossover Works
In the RSI + SMA Crossover Strategy, you look for instances when RSI moves above or below a certain threshold (e.g., 50) while the asset price interacts with SMA lines.
This alignment helps you confirm a potential entry or exit strategy because it adds another layer of verification. If both the RSI signals and SMA cross in the same direction, the probability of a bullish price or bearish price movement can be higher.
Failure swings in the RSI can produce erroneous signals when the SMA does not align. By waiting for an SMA cross to confirm RSI readings, you may avoid jumping into trades prematurely.
(Long)EMA 4H + Stochastic RSI By Nussara(strategy)
EMA 4H + Stochastic RSI by Nussara combines 4-hour exponential moving averages with Stochastic RSI to identify precise trade setups. This anti-repainting strategy excels in detecting overbought and oversold conditions across stocks, crypto, and forex, offering high ROI potential.
(Long)EMA 4H + Stochastic RSI By Nussara(strategy)
Rivian Automotive, Inc. (RIVN)
@ 5 min
1.02
Risk Reward2.64 %
Total ROI275
Total TradesDecoding Key Technical Indicators for Momentum and Price Trend
Not all technical indicators are created equal. However, pairing RSI and SMA can offer a foundation for an effective stock trading strategy. The combination can track market volatility, highlight potential buying opportunity windows, and serve as a benchmark for market comparison.
Understanding RSI Levels and Overbought/Oversold Conditions
Overbought Condition: RSI above 70 often indicates an overbought condition. While this can signal a possible sell signal, waiting for the SMA to confirm a downward trend strengthens your decision.
Oversold Condition: RSI below 30 points to an oversold condition. When this aligns with an SMA cross, it can suggest a bullish reversal if the price rebounds above a critical moving average.
Failure Swings: Keep an eye on RSI failure swings. These occur when the indicator bounces near a support or resistance level but does not cross it. Checking if the SMA lines remain consistent with the RSI momentum helps filter out weak signals.
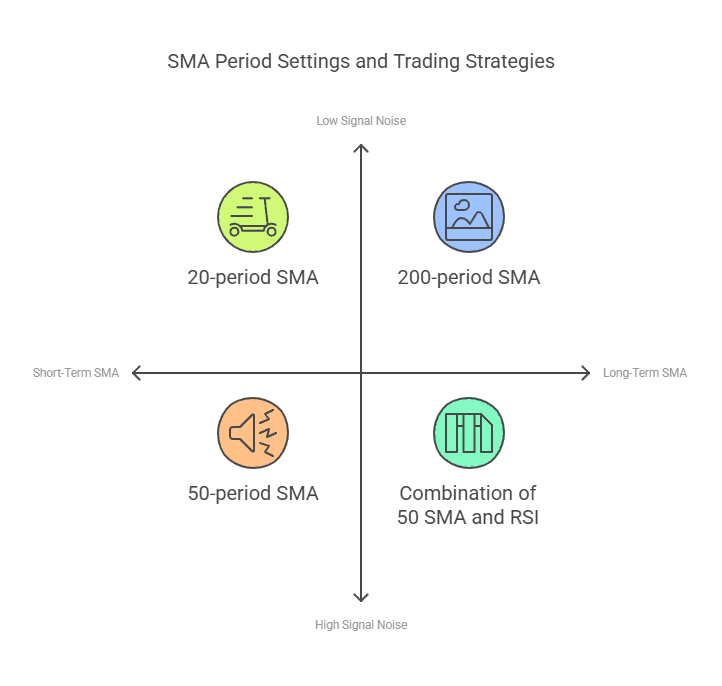
The Importance of SMA Period Settings
Short-Term MA: A short-term SMA (like 20) reflects immediate market trend changes. It is useful for short-term trades, but it can also generate more False signals if the market is volatile.
Long-Term MA: Longer SMAs, such as the 100- or 200-period lines, show the broader market context. They are slower to react, but they minimize short-term noise.
Combining Multiple SMAs: Traders often use two SMA lines (for example, a 50 SMA and a 200 SMA). This average crossover offers strong signal potential when it aligns with RSI thresholds.
Spotting Potential Market Reversals
Bullish Divergence: When the RSI makes higher lows while price action makes lower lows, a bullish divergence might form. Combine it with an SMA cross to confirm the trend shift.
Bearish Divergence: In contrast, a bearish divergence occurs when RSI shows lower highs while the stock price hits higher highs. Watch for SMA cross signals to confirm a downward price direction.
Price Action Candlestick Patterns: Observe price candles near the point of crossover. If bullish price action candlesticks appear when RSI crosses above 50 and the SMA indicates an upward trend, you might have a decent trade signal.
RSI + SMA Crossover Strategy in Varying Market Conditions
Financial markets change. Market conditions can shift from trending to sideways markets. Yet the RSI + SMA Crossover Strategy provides flexibility. It adapts to both bullish market and choppy or range-bound markets if you interpret it correctly.
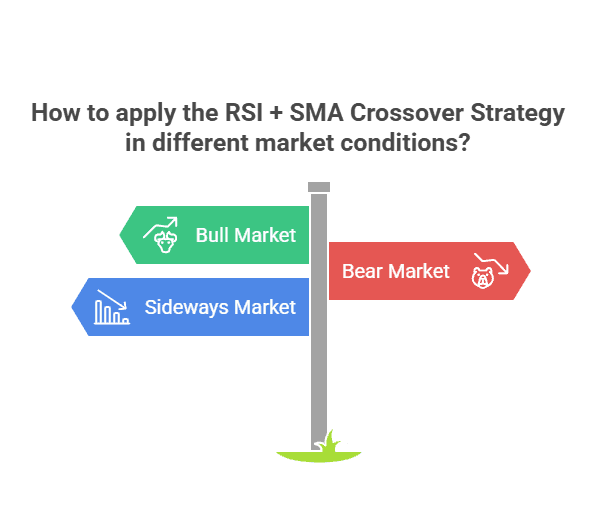
1. Bull Market Dynamics
In a bull market, an upward trend often holds for a sustained period. The SMA lines will slope upward, and the RSI will remain above 50 for longer durations.
Identifying bullish divergences becomes simpler, as price action typically sets higher highs. Look for RSI dips near the 40–50 range, where a bounce above an SMA line can indicate a renewed upward trend.
Keep an eye on potential overbought condition territory. The RSI can stay overbought if the bullish momentum is strong. Waiting for a minor pullback and an SMA cross upward can provide a more efficient point of entry.
2. Bear Market Considerations
During a bear market or downward price phase, the SMA lines start trending downward. RSI values commonly remain below 50.
A significant RSI crossover above 50, coupled with the price crossing a short-term SMA, might suggest a bullish reversal. You could treat this as a potential buying opportunity if it aligns with your risk appetite.
However, remain cautious. False signals increase in a strong downtrend, especially if broader market conditions persist in negative territory. Combine multiple indicators (like Bollinger Bands or volume analysis) to confirm the trade signal.
3. Sideways or Range-Bound Trading
When price fluctuation consolidates, the SMA lines might be flat or twist around each other. RSI readings may hover in the 40–60 zone.
Range-bound phases often produce more crossover signals, some of which can be erroneous signals. Utilize the RSI to confirm if momentum is shifting meaningfully, or wait for a breakout in either direction.
Keeping a tighter stop-loss during sideways market analysis can safeguard your positions from whipsaws.
RSI + SMA Crossover Strategy in Live Market Examples
Using real-world scenarios can solidify your grasp of how the RSI + SMA Crossover Strategy works. Below are a few case studies showing how different financial markets react when certain technical indicators align. Each example highlights how momentum indicators, like RSI, can blend with SMA to produce reliable trading signals.
Stock Example: NSE BAJAJ-AUTO
- Context: Let’s say you are analyzing NSE BAJAJ-AUTO stock for potential market reversals.
- Setup: Your RSI is set to 14, and you have a 50-day SMA plus a 200-day SMA on the chart.
- Observation: The price crosses above the 200-day SMA while RSI climbs above 50. This alignment suggests a bullish signal because it points to an upward trend.
- Trade Execution: You might buy once the crossover signals confirm the bullish momentum. A stop-loss could be placed just below the 200-day SMA, providing control risk in case of sudden market volatility.
- Result: If momentum continues, you could exit when RSI pushes into an overbought condition (above 70) or when a new SMA cross indicates a downside risk.
This example shows that combining RSI and SMA can add clarity. While a price movement above the long-term SMA seems promising, RSI confirmation reduces the odds of entering on False signals.
Forex Example: EUR/USD
- Context: You notice a currency pair, such as EUR/USD, consolidating in sideways markets.
- Setup: The RSI hovers in the 40–60 zone, and the 20-day SMA frequently intersects with the 50-day SMA.
- Observation: Suddenly, RSI breaks above 60, and the 20-day SMA crosses the 50-day SMA from below, generating a trade signal.
- Trade Execution: If you enter a long position, aim for a modest target. Range-bound phases can shift quickly, so you might set a relatively tight stop-loss.
- Result: If the RSI continues above 70, watch for a potential overbought condition. Exiting when RSI begins to dip might preserve average gains.
By focusing on RSI confirmation, you can avoid many erroneous signals in choppy price action. Even if the SMA cross occurs, waiting for RSI to indicate genuine momentum can refine your entry strategy.
Contrarian Approach: NSE BRITANNIA
- Context: Contrarian trading strategies thrive on anticipating potential market reversals when sentiment appears extreme. Suppose NSE BRITANNIA has dropped for several sessions, and RSI has fallen below 30.
- Setup: You spot the 50-day SMA well above the asset price, yet RSI shows a bullish divergence. The price sets lower lows, while RSI forms higher lows.
- Trade Execution: A contrarian might enter a long position if the RSI crosses above 30 and the short-term SMA (20-day) begins sloping upward. You are betting on a possible price rebound.
- Risk Management: If the price fails to climb above the 50-day SMA, exit the trade to limit losses. Keep an eye on broader market conditions, especially if negative sentiment continues.
Contrarian strategies can yield higher rewards, but they also carry elevated risk. Using RSI + SMA crossovers as confirmation can help you spot stronger signs of reversal.
RSI SMA Crossover Strategy
The RSI SMA Crossover Strategy involves opening a long position when the Relative Strength Index (RSI) crosses above the Simple Moving Average (SMA) and closing it when the RSI crosses below the SMA. Optimal RSI and SMA lengths are critical and should be backtested to maximize effectiveness. Historical tests on Bitcoin showed remarkable gains, although backtest settings, such as slippage and commission, must be accurately defined for reliable results.
Tools and Techniques to Enhance the RSI + SMA Crossover Strategy
Traders often refine the RSI + SMA Crossover Strategy by adding more layers of analysis. While maintaining a disciplined risk management approach is essential, pairing your core indicators with secondary tools can provide valuable insights into price trend changes.
Incorporating Bollinger Bands
Bollinger Bands measure price volatility. They place upper and lower bands around an average price, usually a 20-day SMA. If the RSI crosses a critical threshold and price bounces off a Bollinger Band, this confluence can create a strong signal.
In an upward trend, a lower Bollinger Band touch with RSI climbing above 50 and a short-term SMA cross can highlight a potential buying opportunity. In a downward price scenario, the opposite applies.
Beware False Signals in highly volatile pair scenarios. Prices can hit Bollinger Bands frequently without indicating a larger trend change. Always confirm with RSI momentum and SMA positioning.
Multiple Time Frame Analysis
Many traders check a larger time scale (e.g., daily charts) to see if the overall market trend is bullish or bearish. Then they zoom in to a smaller time frame (e.g., 4-hour or 1-hour) for precise entry signals.
If the daily RSI suggests a bullish market, a short-term SMA cross above a longer-term SMA on a 4-hour chart can trigger your trade. This alignment of short-term and long-term trends lowers your chance of jumping into a contrarian position prematurely.
Using multi-time-frame charts can mitigate false breakouts and reduce reliance on any single indicator reading.
Quantitative Trading Strategy and Backtesting
Backtest indicator performance using a quantitative trading strategy. By processing historical data, you can validate the win rate, average profit, and maximum drawdown for your RSI + SMA approach.
Vary your RSI average periods (e.g., from 14 to 10) or test different SMA lengths to see which settings align best with your personal strategy and trading goals.
Market conditions change, so revisit your backtest results regularly. Adjust your parameter settings if the market volatility, time periods, or underlying fundamentals shift.

Sector and Security Selection
High-liquidity assets—like NSE INFY, major currency pairs, or large-cap stocks—offer tighter spreads and lower trading costs.
Rapid price fluctuation around earnings announcements can create spurious crossover signals. Always pair technical analysis with a basic awareness of fundamental drivers.
RSI + SMA crossovers can work for equities, forex, and commodities. Spreading your trades across different instruments may help control risk more effectively.
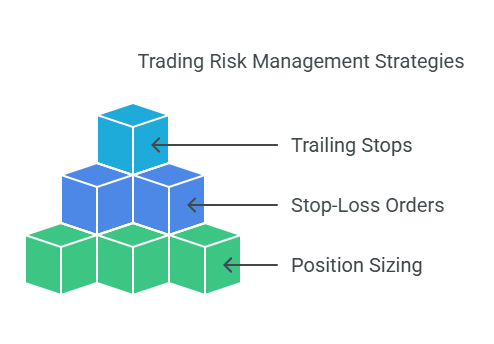
Risk Management Essentials for Crossover Strategies
Building a solid foundation in risk management is vital for any trading strategy, especially when false breakouts or volatile market conditions arise. Implementing position sizing, protective stops, and disciplined exits can be the difference between steady growth and large drawdowns.
Position Sizing and Stop-Loss Placement
- Position Sizing
Allocating a fixed percentage of your trading capital per position keeps downside risk in check. This prevents a single losing trade from wiping out a large portion of your account.
- Stop-Loss Orders
Place stop-loss orders near recent swing lows or below a key SMA line to protect against big losses if price reversals catch you off guard. Stops help you exit quickly if the trade moves against you.
- Trailing Stops
As the trade moves in your favor, a trailing stop can lock in gains. For instance, if you enter a bullish position in a short-term trend and the RSI continues upward, a trailing stop can keep you safe if momentum indicators weaken later.
Setting Realistic Profit Targets
- Risk-to-Reward Ratios
Aim for ratios like 1:2 or 1:3 to ensure that each winning trade potentially covers multiple losses.
- Partial Profit-Taking
In volatile conditions, consider taking partial profits once the price trend moves favorably. This locks in gains while keeping a portion of the position open for further upside.
- Review Market Trend
If a larger trend appears strongly bullish or bearish, you may choose to extend your profit target. Just remember to watch for RSI extremes that might warn of an impending pivot.
Emotional Control and Discipline
- Avoid Chasing Trades
If the RSI is already near overbought condition levels or if the SMA cross occurred several bars ago, jumping in late can lead to a bad entry strategy. Wait for the next valid signal to avoid elevated risk.
- Stick to Your Plan
Emotions often rise when markets get choppy. Rely on your predefined trading rules rather than making impulsive decisions.
- Learn from Every Trade
Keep a trading journal to document reasons for entry, exit, and any post-trade reflections. Over time, patterns in your decision-making become clearer, and you can refine your personal strategy.
Adapting to Broader Market Context
- Fundamental Checks
Economic reports, earnings releases, or major news events can trigger large price fluctuation. If your technical analysis aligns with strong fundamentals, it can offer added conviction in your trades.
- Sector Rotation
Certain sectors or assets may perform better in specific market environments. If the RSI + SMA setup appears across multiple stocks in a sector, it could indicate a broader trend.
- Continuous Improvement
Regularly reassess your approach as financial markets evolve. Adjusting parameter settings for RSI or SMA might be necessary if you notice changes in volatility or if your false signals begin to rise.
Conclusion: Maximizing Returns with the RSI + SMA Crossover Strategy
RSI + SMA Crossover Strategy remains one of the most beginner-friendly yet powerful approaches to finding profitable ratio Strategy setups in a wide range of financial markets. When the RSI clearly indicates momentum shifts, and SMA lines confirm a bullish or bearish trend, the synergy can yield strong signal confirmations. This dynamic pairing of momentum indicators helps you identify potential entry points, secure exit signals, and maintain tighter risk controls.
By monitoring overbought condition and oversold condition readings, you can minimize downside risk. Adding extra filters, like Bollinger Bands or multi-time-frame market analysis, refines the strategy further. You become more prepared to recognize both short-term trades and longer trend-following opportunities. Additionally, consistent backtest indicator performance reviews allow you to gauge whether your parameter settings or average periods need adjustments as market conditions evolve.
Despite its accessibility, the RSI + SMA Crossover Strategy does not guarantee success in every trade. No single concept of crossover signals is foolproof, so you must stay prepared for occasional False signals. If your quantitative trading strategy identifies an elevated number of losses in certain time periods, consider revisiting your choice of SMA lengths or rethinking when to act on RSI thresholds. Flexibility and ongoing learning form the backbone of consistent results.
Keep in mind the following final best practices:
- Stick to Disciplined Risk Management: Use stop-loss orders, define position sizing, and plan your exit strategy before jumping in.
- Combine Multiple Indicators Wisely: Pair the RSI and SMA setup with other technical analysis tools, such as a Price Channel or average convergence divergence (MACD), for added confirmation.
- Review Different Market Environments: Whether you’re trading in a bull market or facing sideways markets, adapt your strategy to detect potential buying opportunity windows and avoid whipsaw moves.
- Refine Your Approach Through Backtesting: Gather performance data. Then adjust your average crossover strategies or time scale when patterns in your results indicate improvement opportunities.
Mastery of this crossover strategy often comes with time, patience, and continuous practice. As you grow more confident, you can expand into more complex strategy ideas, like contrarian trading strategies or combining multiple momentum indicators for a more nuanced view of price action. Over time, the RSI + SMA Crossover Strategy can become a cornerstone of your trading toolkit, enhancing your ability to spot bullish reversal clues, manage bearish reversal risks, and capitalize on profitable entries.
Ready to elevate your trading game?
Start applying the RSI + SMA Crossover Strategy with confidence using TradeSearcher. Our powerful backtesting tool helps you analyze strategies, identify optimal setups, and maximize your ROI. Try TradeSearcher today!