Table of Content
The Ultimate Guide to Stock Backtesting: Strategies, Tools & Tips
By Vincent Nguyen
Updated 536 days ago
Why Stock Backtesting Is a Game-Changer for Traders
Stock backtesting is one of the most crucial steps for any trader or investor looking to validate potential trading strategies using historical market data. In a world of volatile price movements and rapid market shifts, relying on guesswork or intuition alone can be risky. That’s where stock backtesting comes in—it serves as your “time machine,” allowing you to travel back in history, apply your trading rules, and see how those rules would have performed under real market conditions.
In this comprehensive guide, we’ll cover everything a beginner needs to know: what stock backtesting is, why it matters, the essential methodologies, and a step-by-step approach to running your own backtests. We’ll also delve into common pitfalls—such as data snooping and overfitting—that can skew your results, and we’ll show you how to interpret backtesting metrics like drawdowns, win/loss ratios, and Sharpe ratios. To top it off, we’ll list some of the most popular and reliable stock backtesting tools so you can start experimenting immediately.
By learning how to conduct a proper stock backtest, you’ll be better equipped to refine your trading strategies, minimize risk, and potentially increase your returns. This is particularly important in today’s fast-paced markets, where algorithmic and high-frequency trading strategies dominate. Even if you’re just a casual investor or swing trader, mastering the basics of stock backtesting can empower you to make more informed decisions.
The goal of this guide is to present complex ideas in a beginner-friendly manner. You’ll discover how to gather quality historical data, design a methodical backtest, and interpret the results in a way that helps you stay objective. Plus, we’ll highlight the key tools—both free and paid—that can streamline your workflow and help automate the process. Let’s begin by defining what stock backtesting really is and why it plays a vital role in modern trading.
What Is Stock Backtesting?
Stock backtesting is the process of evaluating a trading strategy’s effectiveness by applying its rules to historical market data. The fundamental idea is simple: if you can see how a strategy performed in the past, you may gain insights into how it might perform in the future. Of course, no one can predict the future with certainty, but stock backtesting provides a data-driven framework to test whether your trading concepts hold up under real-world conditions.
Breaking Down the Concept
At the heart of any backtest lies historical price and volume data. Traders typically use data sets that include daily (or intraday) opens, highs, lows, and closes (often abbreviated as OHLC). Some strategies also consider fundamental factors like earnings reports or economic indicators, but the simplest forms of backtesting typically rely on price and volume.
Once you load the historical data into a backtesting tool or platform, you’ll simulate trades based on specific entry and exit rules. For instance, your strategy might say, “Buy when the 50-day moving average crosses above the 200-day moving average, and sell when it crosses below.”
The backtesting software will record each simulated trade and calculate various performance metrics, such as total return, drawdown, and win rate. These metrics help you gauge whether your strategy is robust or needs improvement.
Key Terms
- Data Set: The collection of historical price and volume data over a chosen time frame.
- Technical Indicators: Mathematical calculations based on price or volume that traders use to generate buy or sell signals (e.g., RSI, MACD, moving averages).
- Entry/Exit Signals: The conditions that must be met to open or close a position.
- Overfitting: A common pitfall where a strategy is too closely tailored to past data, potentially reducing its future effectiveness.
Why It Matters
Stock backtesting is widely used by hedge funds, proprietary trading firms, and individual retail traders alike. It allows for a more systematic and rational approach to the markets, reducing the emotional biases that often lead to mistakes. However, it’s important to remember that historical performance doesn’t guarantee future results; stock backtesting is just one tool in a broader set of risk management and market analysis methods.
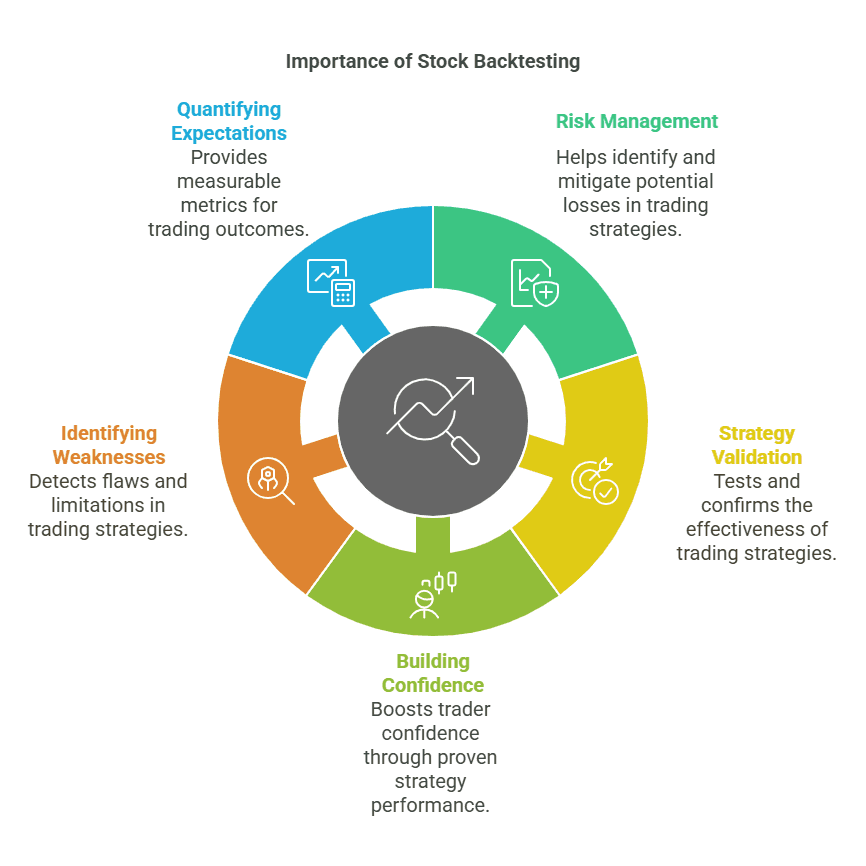
Why Stock Backtesting Is Important
Stock backtesting is not just a fancy exercise—it’s a cornerstone of modern trading. If you’re serious about developing a profitable strategy, backtesting helps separate the wheat from the chaff by providing objective data on whether your trading rules show promise or not.
Risk Management
One of the biggest advantages of stock backtesting is its role in risk management. By simulating trades on past data, you can quickly identify periods where your strategy might suffer large drawdowns. This information can be invaluable for position sizing, stop-loss levels, and overall portfolio diversification.
Strategy Validation
Many beginner traders make the mistake of trying out random strategies without any form of validation. Stock backtesting offers a reality check. You can see if your moving average crossover idea actually performs better than a simple buy-and-hold approach—or if it’s just a “gut feeling.”
Building Confidence
Confidence is crucial when you’re putting real money on the line. A well-tested strategy that has shown consistent performance in multiple market conditions—bullish, bearish, and sideways—can help you stay disciplined. Knowing that your rules have worked in various scenarios can make it easier to stick to your plan instead of abandoning it after a few losing trades.
Identifying Weaknesses
No trading system is perfect, and stock backtesting helps you spot potential flaws early. Perhaps your strategy struggles in choppy markets or fails to capitalize on strong momentum. Identifying these weaknesses can lead you to adjust parameters or introduce filters that improve overall performance.
Quantifying Expectations
Trading is rife with vague promises of success, but few people talk about realistic expectations. Through backtesting, you can quantify metrics like:
- Average return per trade
- Maximum drawdown
- Win/loss ratio
- Sharpe ratio (a measure of risk-adjusted returns)
These numbers paint a clearer picture of what you might reasonably expect. While they aren’t predictive guarantees, they provide a framework for setting realistic goals and risk thresholds.
Understanding the Basics of Methodology
Before diving into the nuts and bolts of stock backtesting, it’s essential to grasp the basics of how methodologies are structured. A backtest is only as good as the data, assumptions, and rules driving it.
Data Collection and Quality
- Reliability: High-quality, trustworthy data is the bedrock of accurate stock backtesting. Low-quality data—filled with missing prices, inaccurate timestamps, or stale quotes—can lead to misleading results.
- Sources: Some traders use free data sources like Yahoo Finance, while others prefer paid, institutional-grade feeds that guarantee minimal latency and error rates.
- Extent of Data: The more historical data you have, the better. Ideally, you want your dataset to span multiple market cycles (bull, bear, and sideways) to capture various types of volatility and economic conditions.
Period Selection
Deciding which time period to test can heavily influence your results. For example, a strategy that works extremely well in a raging bull market might fall apart in a bear market. Ideally, you’ll choose:
- Multiple Timeframes: Daily, weekly, and even intraday data for advanced testing.
- Market Cycles: Include data from financial crises, expansions, and periods of relative stability.
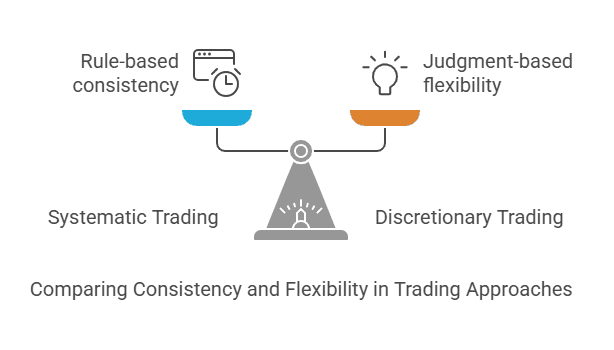
Systematic vs. Discretionary Trading
- Systematic: Involves strict, rule-based criteria. For instance, you might buy a stock when a moving average crosses above another moving average and sell when it crosses below.
- Discretionary: Relies on the trader’s judgment to some extent. While discretionary traders can still conduct backtesting, it’s trickier to account for subjective factors like “market sentiment” or “intuitive reading” of charts.
Common Approaches to Stock Backtesting
Not all stock backtesting is created equal. There are various methods traders employ, each with its own pros and cons. Understanding these approaches can help you decide which style aligns best with your goals and skill set.
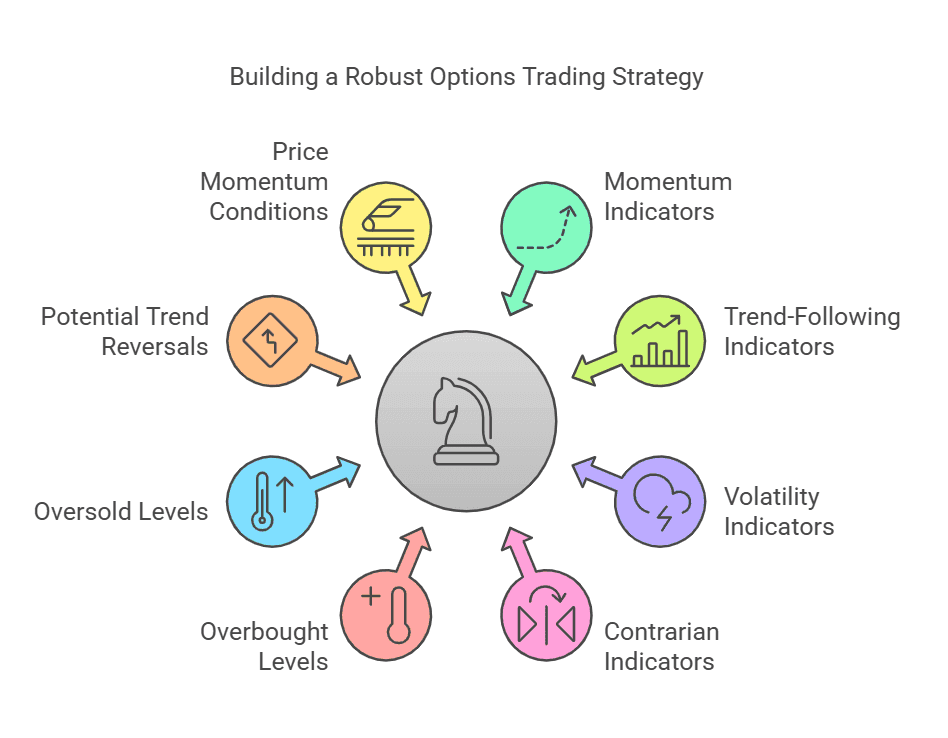
Technical Indicator-Based Backtesting
Arguably the most common approach, technical indicator-based backtesting uses indicators like the Moving Average Convergence Divergence (MACD), Relative Strength Index (RSI), and Bollinger Bands to generate buy/sell signals.
- Pros: Straightforward rules, easy to automate, widely studied.
- Cons: Can lag behind price, potentially leading to late entries/exits.
Price Action and Chart Patterns
Some traders rely on patterns such as head-and-shoulders, double bottoms, or ascending triangles. These patterns are more discretionary, but they can still be backtested systematically by defining precise criteria for pattern recognition.
- Pros: Focuses on pure price movement, minimizing lag.
- Cons: Pattern recognition can be subjective, leading to inconsistent signals.
Quantitative Strategies
Quantitative trading strategies often involve mathematical models, factor-based approaches, or statistical arbitrage. These can include:
- Momentum: Buying assets that have performed well in the recent past, expecting continued outperformance.
- Mean Reversion: Buying oversold assets and selling overbought assets, anticipating price reversals.
- Factor Investing: Leveraging metrics like value (P/E ratios), quality (profit margins), or volatility.
Machine Learning & AI
More advanced traders may incorporate machine learning algorithms, neural networks, or genetic programming to identify patterns in large datasets. While these approaches can be powerful, they also carry higher risks of overfitting due to the complexity of models.
Balancing Pros and Cons
It’s worth noting that each approach to stock backtesting may respond differently to changes in market structure, interest rates, or sentiment. The best method is often one that aligns with your personal style, risk tolerance, and technical abilities.
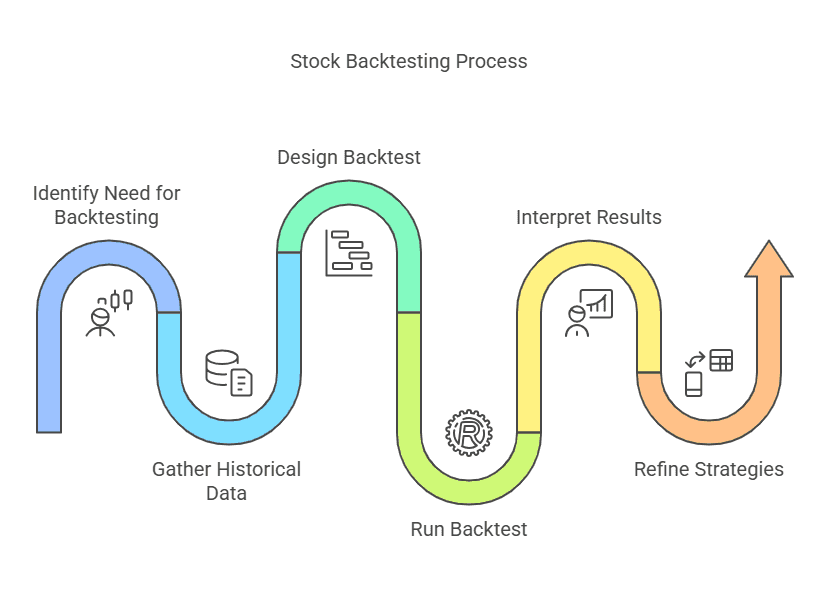
Step-by-Step Process for Stock Backtesting
A methodical approach to stock backtesting ensures you don’t miss critical steps. Below is a simplified roadmap that you can adapt to your own trading needs.
1. Define Your Strategy
- Be explicit about entry and exit rules. For instance: “Buy when the 50-day SMA crosses above the 200-day SMA, sell when it crosses below.”
- Determine stop-loss and profit-target rules if applicable.
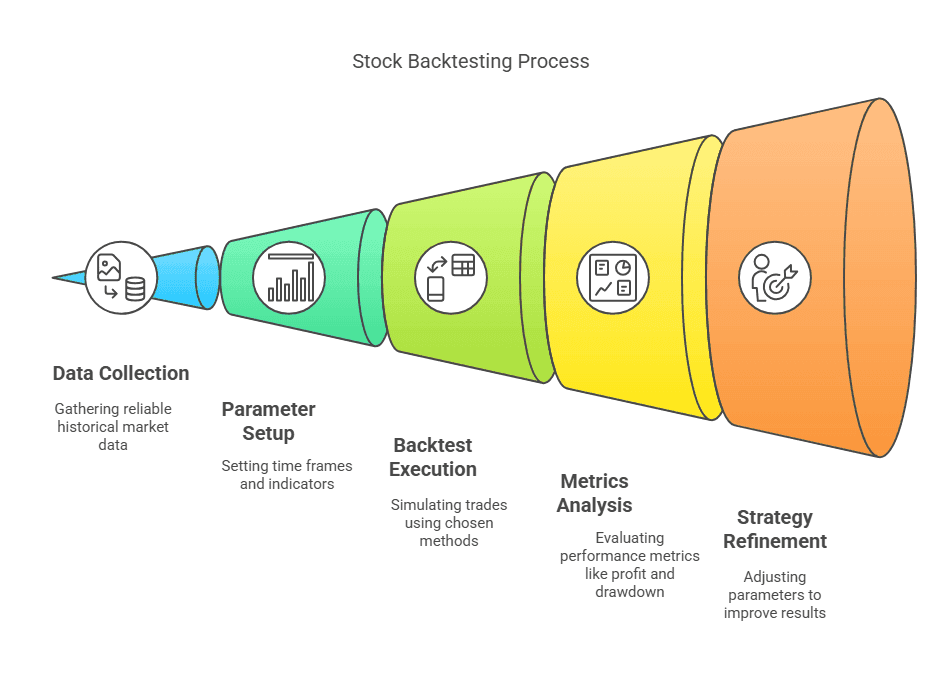
2. Gather Historical Data
- Acquire reliable data that covers various market conditions.
- Check for data accuracy; missing or incorrect prices will compromise your results.
3. Set Up Parameters
- Decide on the time frame (e.g., 5 years, 10 years).
- Select which indicators or signals you’ll use.
- Decide if you’re including transaction costs and slippage.
4. Run the Backtest
- Use either automated software or a manual spreadsheet approach.
- Simulate how your trades would have played out day by day (or bar by bar in intraday strategies).
5. Analyze Metrics
- Profit/Loss: Look at overall gains, annualized returns, and average returns.
- Drawdown: Identify the worst peak-to-trough decline.
- Win/Loss Ratio: Measures how often you have winning trades versus losing trades.
- Sharpe Ratio: Assesses risk-adjusted returns by comparing average returns to volatility.
6. Refine & Optimize
- Adjust parameters if the results are unsatisfactory, but do so cautiously to avoid overfitting.
- Consider testing different time frames or additional indicators to see if they improve consistency.
7. Forward Test (Optional but Recommended)
- After finalizing the strategy, try it out in a live or demo environment for a period.
- This helps confirm that your results aren’t overly reliant on historical idiosyncrasies.
Case Study Example
Imagine a simple moving average crossover strategy:
- Rules: Buy when the 50-day SMA crosses above the 200-day SMA; exit when it crosses below.
- Data: Five years of daily data on a popular stock index like the S&P 500.
- Backtest Results: You might find a moderate annualized return but also catch significant drawdowns during volatile periods. With optimization, you might tweak the period for the short moving average to 55 days or 60 days and re-run the test, analyzing changes in performance metrics.
Essential Tools and Software for Stock Backtesting
Selecting the right platform or software for stock backtesting can significantly streamline your workflow. Below is a list of popular tools that cater to a range of skill levels and budgets.
1. TradeSearcher
- Overview: Offers instant backtests and strategy comparisons for a variety of tickers, including crypto, stocks, and forex.
- Why It’s Useful: Ideal for both beginners and advanced traders who want quick results and an easy interface.
- Key Features: Automated strategy creation, drag-and-drop indicators, and robust performance analytics
2. TradingView
- Overview: A cloud-based charting platform widely used for its intuitive interface.
- Backtesting Method: TradingView utilizes Pine Script, a simple scripting language to create custom indicators and strategies.
- Pros: Large user community, extensive library of user-generated scripts, cross-device compatibility.
- Cons: Might have limitations for extremely advanced or high-frequency strategies.
3. MetaTrader 4/5
- Overview: Known for Forex but also supports stock CFDs.
- Backtesting Method: Uses MetaEditor for coding Expert Advisors (EAs).
- Pros: Well-established, large user base, tons of free and paid indicators/Expert Advisors.
- Cons: Primarily focused on Forex, so stock coverage may vary depending on the broker.
4. AmiBroker
- Overview: A feature-rich platform known for its speed and flexibility in scripting complex strategies.
- Pros: Fast optimization, advanced charting, robust formula language.
- Cons: Steeper learning curve, not as beginner-friendly.
5. MultiCharts
- Overview: Offers advanced analytics and real-time market data.
- Pros: High-level customization and automation capabilities.
- Cons: More expensive than many other platforms, better suited for professional traders.
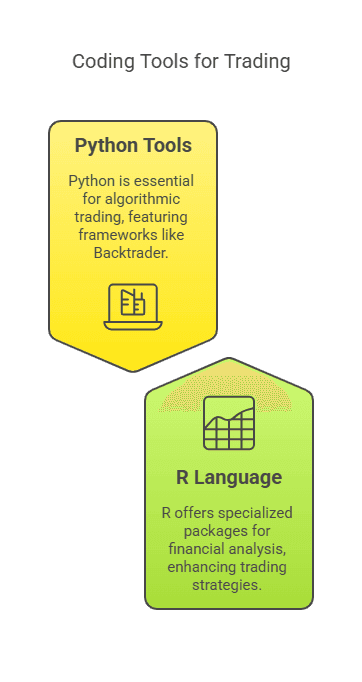
Coding & Script-Based Tools
- Python (Backtrader, pandas, NumPy): Python has become the go-to language for algorithmic traders. Backtrader, for instance, is a versatile framework that simplifies strategy creation, data handling, and performance analytics.
- R: Another open-source language with packages specifically tailored to financial analysis (e.g., quantmod, TTR).
Spreadsheets
- Excel/Google Sheets: Beginners often start here to manually calculate trade outcomes. While this can be time-consuming, it’s an excellent way to learn the fundamentals without needing to code.
Choosing the Right Tool
- Cost vs. Value: Free tools can be sufficient for learning, but premium solutions may offer more reliable data and advanced features.
- Learning Curve: If you’re comfortable with coding, open-source tools like Python might be ideal. Otherwise, a user-friendly GUI platform might be best.
Interpreting Your Results
Running a stock backtest is only half the battle. The real power lies in interpreting the results accurately, without falling into common traps or biases.
Performance Metrics
- Overall Return: The total percentage gain or loss over the testing period.
- Annualized Return: A normalized figure that shows how much you’d earn (or lose) each year, on average.
- Volatility: Often measured as standard deviation of returns; a higher number indicates more fluctuation.
- Drawdown: The largest percentage drop from a peak to a trough during the backtest.
Risk Measures
- Sharpe Ratio: Indicates risk-adjusted returns by dividing excess returns by volatility. A higher Sharpe suggests better risk-reward balance.
- Sortino Ratio: Similar to Sharpe but focuses only on downside volatility, which can be more relevant for traders concerned about drawdowns.
Sample Size & Statistical Significance
- Number of Trades: If you only have 10 trades in a 5-year period, your results might not be statistically meaningful.
- Consistency Across Different Periods: A strategy that works consistently over various market cycles is generally more reliable.
Realistic Expectations
Always remember that past performance doesn’t guarantee future results. Stock backtesting can’t account for every real-world variable—like sudden black swan events, slippage from large order sizes, or changes in market structure. That said, it does provide a valuable framework for making educated assumptions and refining your approach.
Example of Result Interpretation
- Scenario: Your backtest on a momentum strategy yields a 20% annualized return with a Sharpe ratio of 1.2 and a maximum drawdown of 35%.
- Interpretation: While the returns seem attractive, a 35% drawdown suggests a high volatility strategy that might be unsuitable for traders with lower risk tolerance. You might explore ways to reduce drawdown, such as scaling out of positions or employing a trailing stop.
Best Practices and Common Mistakes in Stock Backtesting
Even the best traders can fall victim to mistakes if they aren’t careful. Below are some key practices to keep your stock backtesting process on track—and pitfalls to avoid.
Best Practices
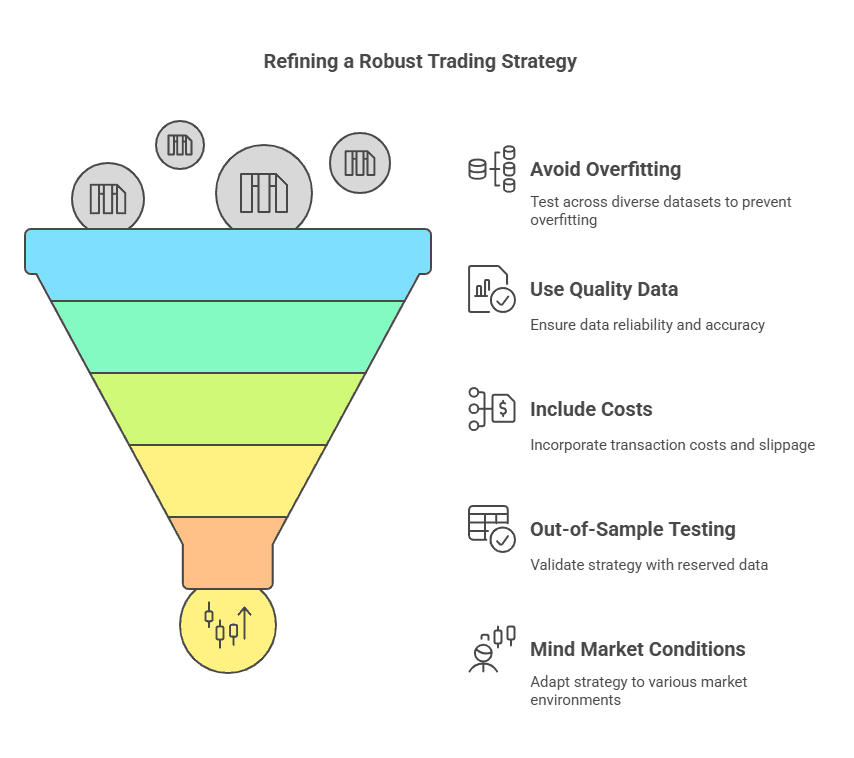
1. Avoid Overfitting
Test your strategy on multiple datasets. If you only optimize for one time period, you might be over-optimizing (curve-fitting) to that specific market environment.
Keep your strategy rules as simple as possible. Complex models with many parameters are more prone to overfitting.
2. Use Quality Data
Spend the time (and sometimes money) to get reliable data that covers different market regimes.
Check for split adjustments, dividend adjustments, and data errors.
3. Include Transaction Costs & Slippage
Real trading involves commissions, spreads, and potential slippage. Failing to account for these can inflate your backtest results.
Factor in different broker fee structures, as these can vary greatly.
4. Out-of-Sample Testing
Reserve a portion of your historical data for final testing after you finish optimizing.
This helps confirm whether your strategy is truly robust or just tailored to a particular dataset.
5. Mind Market Conditions
Stock backtesting should ideally cover bullish, bearish, and sideways markets.
Consider the impact of macroeconomic events like recessions or interest rate changes.
Common Mistakes
- Data Snooping: Adjusting your strategy after repeatedly peeking at the data.
- Ignoring Fundamentals: Technical strategies might fail if an unexpected earnings miss or global event disrupts the market.
- Emotional Bias: Letting personal convictions override the data. For instance, refusing to discard a losing strategy because it “feels” right.
- Lack of Proper Risk Controls: Even a profitable strategy can result in massive losses if position sizes and stop-loss orders aren’t well managed.
The Balance of Adaptation
Markets evolve. A strategy that worked beautifully in the 1990s might not fare as well today. Successful traders keep refining their approaches, employing both backward-looking data and forward-looking analysis to adapt to new market realities.
Conclusion
Stock backtesting is a powerful method for traders and investors to evaluate trading ideas before risking real capital in the markets. By systematically simulating trades over historical data, you can gain invaluable insights into a strategy’s potential strengths, weaknesses, and adaptability to different market conditions. However, it’s important to remain cautious: while a strong backtest can increase your confidence, it’s not an ironclad guarantee of future success.
To get started, gather high-quality data, define clear trading rules, and choose a reliable platform or software for running your stock backtesting. Then, interpret the results carefully, paying close attention to performance metrics like drawdowns, Sharpe ratios, and win/loss ratios. Keep a watchful eye on overfitting by testing your strategies across multiple market environments and reserving some data for out-of-sample validation. Lastly, remember to factor in transaction costs, slippage, and the ever-changing nature of the markets.
Ultimately, stock backtesting serves as a vital stepping stone in your journey toward developing robust, data-driven trading strategies. When combined with sound money management and ongoing market awareness, it can significantly enhance your decision-making process and help you avoid costly pitfalls. Now that you have a grasp of the essentials, consider experimenting with one of the tools mentioned in this guide—because nothing beats hands-on experience when it comes to refining your skill in stock backtesting.
Take your trading to the next level with TradeSearcher.
Validate your strategies, reduce risk, and trade with confidence by leveraging our cutting-edge backtesting tools. Click here to get started now!
You'll also like
Reading about strategies is step one
Answer a few questions and get matched with backtested strategies that fit your style.