Table of Content
Guide to TradingView Backtesting: Step-by-Step for Beginners
By Vincent Nguyen
Updated 549 days ago
Guide to TradingView backtesting
Guide to TradingView backtesting is one of the most critical steps you can take in refining your trading strategies and gaining confidence in your market decisions. Whether you’re brand-new to TradingView or you’ve only scratched the surface of its charting tools, mastering backtesting will help you test your trading ideas against historical data before risking real capital.
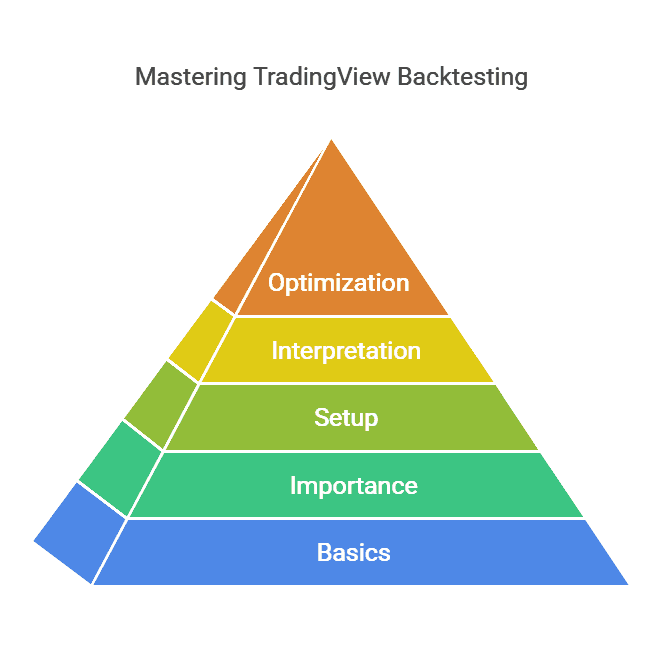
In this comprehensive guide, we’ll walk through the basics of TradingView, discuss why backtesting is so important, explain how to set up a proper testing environment, and dive into the nuances of interpreting results. By the end, you’ll be fully equipped to create, analyze, and optimize your own TradingView backtests for long-term success.
Understanding the Basics of TradingView
TradingView is a widely popular cloud-based platform that caters to traders and investors of all skill levels. What sets it apart is its robust charting system, extensive library of user-created scripts, and an active social community where ideas are exchanged and refined in real time. Before we zero in on backtesting, let’s take a quick look at the foundational features that TradingView offers and why it’s such a go-to platform.
Accessible from Anywhere
Because TradingView is web-based, you can access your charts and strategies anywhere you have an internet connection. This makes it easy to stay in tune with your strategies whether you’re at home, in the office, or on the move.
Multiple Markets in One Place
TradingView supports stocks, ETFs, forex pairs, cryptocurrencies, commodities, and more. This multi-market compatibility means you can test strategies across various asset classes without needing multiple platforms.
User-Friendly Charting
Perhaps the biggest draw of TradingView is its intuitive interface. You can easily:
- Zoom in and out of charts,
- Customize color schemes,
- Layer multiple indicators,
- Annotate with text or drawings.
Free and Paid Plans
While TradingView provides a free plan that’s sufficient for many beginners, paid tiers (Pro, Pro+, and Premium) offer expanded functionality. This includes:
- More indicators per chart,
- Fewer limitations on saved layouts,
- Quicker data updates,
- The ability to use more advanced backtesting scripts and tools.
Understanding these basics lays a solid foundation. When we start talking about backtesting in TradingView’s Strategy Tester or Pine Script environment, you’ll already be familiar with how things fit together.
Why “Guide to TradingView backtesting” Is Essential for Traders
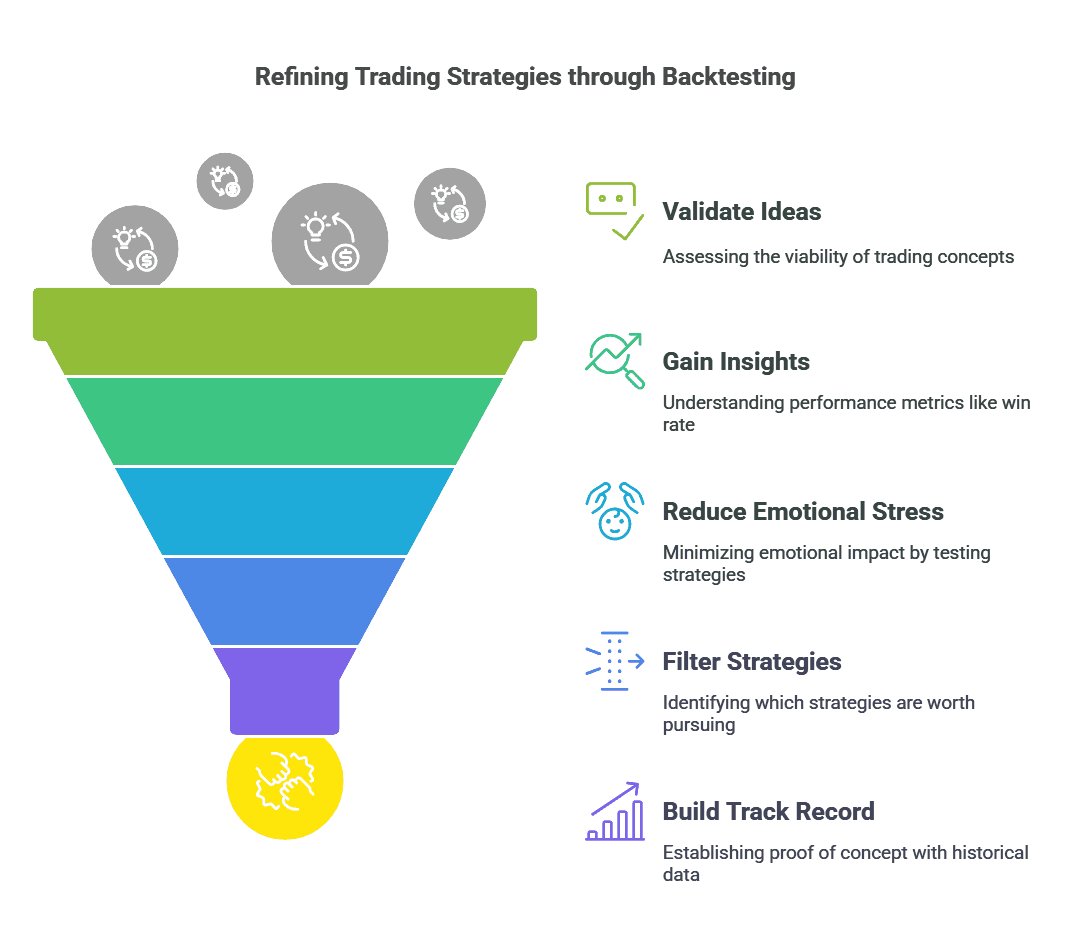
A comprehensive Guide to TradingView backtesting helps you validate or discard trading ideas efficiently. Instead of risking money on untested strategies, you can simulate trades on historical data to see what might have happened in the past.
Time and Cost Efficiency
By running a backtest, you gain insights into a strategy’s performance metrics such as win rate, profit factor, and maximum drawdown all within minutes. This approach saves you the time and cost of trial-and-error in live markets.
Reduced Emotional Stress
Live trading can be emotionally charged. With a proper Guide to TradingView backtesting, you remove the emotional element by verifying if a strategy had consistent success or frequent failures historically. This in turn boosts your confidence when you finally trade live.
Filtering Out Poor Strategies
Not every idea is worth pursuing. Many novice traders jump from one indicator to another, hoping to find a “holy grail.” Backtesting narrows down the field, making it clear which strategies have potential and which don’t.
Building a Solid Track Record
If you plan to manage other people’s money or simply want to track your progress, having historical backtest data can serve as proof of concept. It shows that you are methodical and data-driven, traits that are crucial for consistent profitability.
Setting Up Your TradingView Account for Effective Strategy Testing
Before you can dive into running any Guide to TradingView backtesting, you’ll need to set up your TradingView account properly. Below are the key steps to get you started on the right foot.
Account Creation
Sign Up: Head to the TradingView website and create an account using your email or social media logins.
Verification: Confirm your email address to unlock the core features of the platform.
Subscription Choice: If you’re on a free plan, you’ll have limitations on how many indicators you can use and how many layouts you can save. Serious traders often upgrade for advanced features like faster data feeds and multiple backtesting scripts.
Subscription Tiers and Their Impact on Backtesting
- Free Plan: You can still do basic backtesting, but your ability to load multiple indicators on the same chart is limited.
- Pro, Pro+: Fewer ad interruptions, more indicators, and more flexibility with chart layouts.
- Premium: Offers the maximum number of indicators per chart, enhanced data speed, and unlimited saved chart layouts ideal for those who wish to do extensive backtesting.
Pine Script Basics
TradingView uses a proprietary language called Pine Script for creating indicators and strategies. Even if you don’t plan to code your own scripts:
- Familiarize yourself with the Pine Editor (found at the bottom panel).
- Understand the difference between an indicator (which shows calculations like moving averages) and a strategy (which can trigger hypothetical trades).
You don’t need to be a Pine Script expert to start backtesting. However, understanding its fundamentals can open the door to customizing stop-loss levels, take-profit levels, and other parameters in ways that a generic script may not allow.
Navigating the “Guide to TradingView backtesting” Tools and Features
Once your account is set up, it’s time to explore TradingView’s Strategy Tester—the central hub for backtesting. Accessed via the bottom panel, the Strategy Tester displays how a particular strategy performed during a selected time range.
Strategy Tester Overview
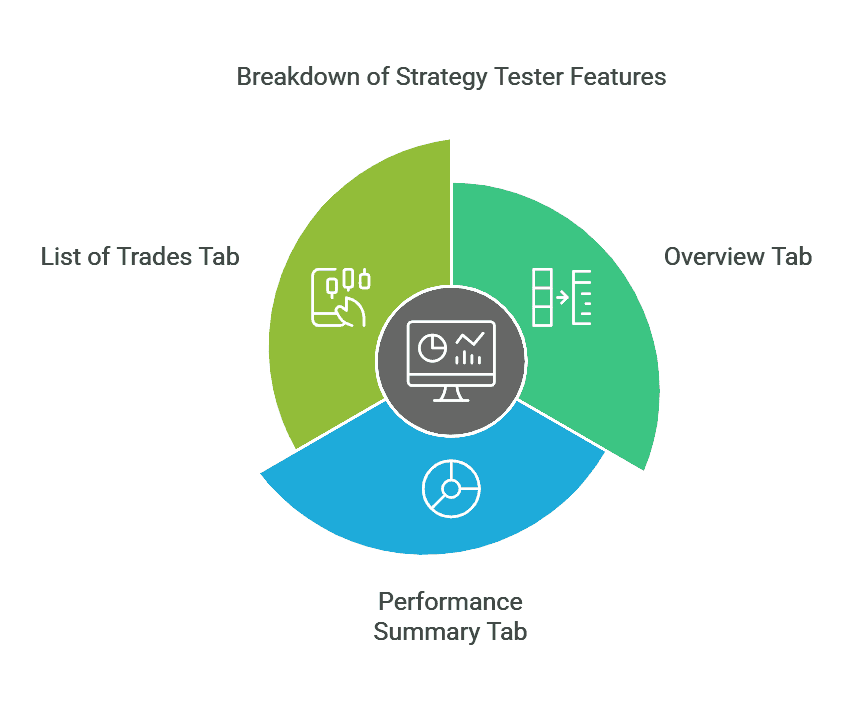
- Overview Tab: Here, you’ll see a quick summary of your strategy’s net profit, total closed trades, percentage of profitable trades, and more.
- Performance Summary Tab: This offers deeper insights into metrics such as Max Drawdown, Win Rate, Profit Factor, and possibly ratios like Sharpe or Sortino, depending on the script.
- List of Trades Tab: Every hypothetical trade the strategy generated is listed here with entry date, exit date, profit/loss, and cumulative profit.
Real-Time vs. Historical Data
When you apply a strategy to a chart, TradingView automatically calculates how it would have behaved on past price data. You can also observe how it performs in real-time if you keep the chart open, but remember: real-time observation is forward testing, which is different from backtesting historical data.
Data Range Selection
TradingView often defaults to “entire history” or a certain recent timeframe. You can modify the backtesting range by:
- Scrolling left or right on the chart,
- Zooming in or out,
- Selecting specific date ranges.
A well-rounded Guide to TradingView backtesting approach typically involves testing over varied market conditions (uptrend, downtrend, sideways) to see how robust your strategy truly is.
Step-by-Step “Guide to TradingView backtesting” Process
In this section, we’ll detail a clear workflow for backtesting a strategy on TradingView. Follow these steps to ensure you aren’t missing any crucial details.
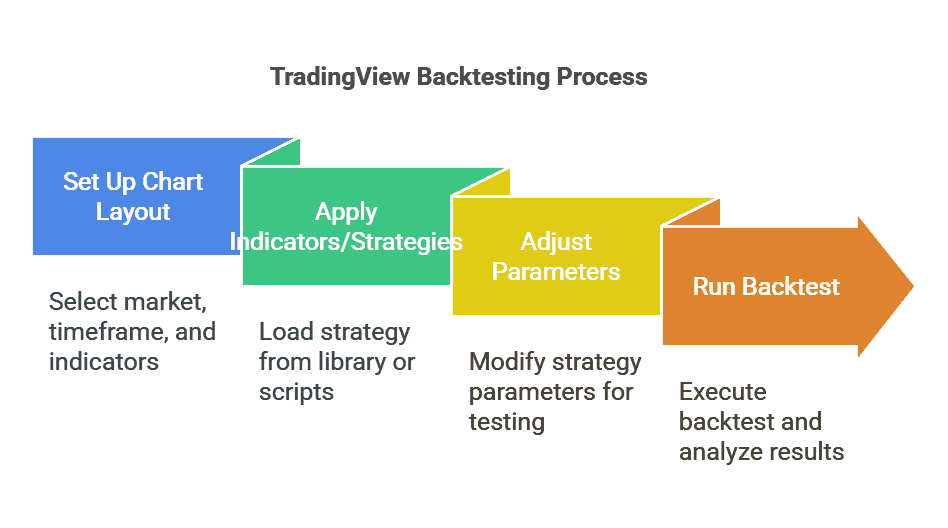
Step 1: Setting Up the Chart Layout in “Guide to TradingView backtesting”
Before you can run a backtest, you need to select:
- Market/Symbol: Decide which market you want to test (e.g., BTC/USD, EUR/USD, AAPL).
- Timeframe: Determine your trading style scalping (1-minute or 5-minute), day trading (15-minute or 30-minute), swing trading (4-hour or daily), or position trading (weekly).
- Indicators/Strategies: Load the strategy you wish to test. This could be a built-in TradingView strategy like “Moving Average Cross Strategy,” or a community script from the Public Library.
Example: If you’re a crypto trader interested in swing trading, you might load the BTC/USD daily chart and apply the “Moving Average Cross Strategy” built into TradingView.
Step 2: Applying Indicators or Strategies in “Guide to TradingView backtesting”
Distinguish between indicators and strategies:
- Indicators: Display calculated values (e.g., RSI, MACD, moving averages), but they do not generate hypothetical trades.
- Strategies: Contain specific entry and exit rules. Once applied, TradingView’s Strategy Tester can simulate the trades.
After deciding on a strategy:
- Go to the Public Library or My Scripts if you wrote your own Pine Script.
- Click “Add to Chart.”
- The chart will automatically update with trade markers (long or short) and the Strategy Tester panel will populate data about your backtest.
Step 3: Adjusting Parameters for “Guide to TradingView backtesting”
Most strategies come with configurable parameters. For instance:
- Length of moving averages,
- RSI threshold for overbought or oversold,
- Stop-loss or take-profit percentages.
Small changes in these parameters can create vast differences in outcomes. This is why it’s vital to:
- Tweak settings one at a time,
- Re-run the backtest,
- Log the results in a spreadsheet or note to compare performance.
Balancing your parameters to avoid overfitting (where a strategy is too optimized to past data) is a skill that comes with practice.
Step 4: Running the Backtest
Once your preferred strategy and parameters are set, it’s time to:
- Open the Strategy Tester panel at the bottom of your chart.
- Check the Overview tab for a quick summary of net profit, number of trades, and the strategy’s percentage of profitable trades.
- Navigate to the Performance Summary for deeper metrics like max drawdown and average trade.
- Review the List of Trades to see each hypothetical trade.
Consider changing the time range you’re testing. For example, you may want to test your strategy’s performance during:
- A bullish market period,
- A bearish market period,
- A sideways market.
This broad testing approach will help you gauge how well the strategy adapts to different conditions.
Interpreting Backtesting Results
Running a backtest is only half the battle; understanding the numbers and what they mean is equally critical. Let’s look at the key metrics you’ll encounter in your Guide to TradingView backtesting.
Net Profit
This is the total profit or loss your strategy would have generated over the chosen time frame. While a positive net profit is a good sign, it doesn’t tell the whole story.
Win Rate
Often displayed as a percentage, this indicates how many trades were profitable out of the total trades. However, a high win rate alone doesn’t guarantee profitability. If your losses when you’re wrong are huge, the strategy can still fail.
Profit Factor
Profit Factor is calculated as Gross Profit / Gross Loss. A Profit Factor above 1.0 means the strategy generated more profit than loss. Many consider a Profit Factor above 1.5 as strong, though context matters.
Maximum Drawdown
Max Drawdown is the largest peak-to-trough drop in your strategy’s equity curve. A strategy may have impressive net profit but could be nearly impossible to trade if it experiences massive drawdowns. Understanding and tolerating drawdowns is key to real-world feasibility.
Average Trade
Sometimes expressed in terms of a percentage or dollar value, the average trade helps gauge how much you stand to gain or lose per trade. If the average trade is too small, transaction costs and slippage could eat into profits.
Sharpe and Sortino Ratios (If Available)
Depending on the strategy script, you might also see:
Sharpe Ratio: Measures risk-adjusted returns relative to volatility.
- Sortino Ratio: Similar but focuses only on downside volatility, which can be more relevant for some trading styles.
Analyzing Over Timeframes
Don’t rely on just one timeframe (like a 1-hour chart). Review your strategy on multiple timeframes to see if its performance changes drastically. A robust strategy often works consistently across different time horizons, albeit with some parameter tweaks.
Common Pitfalls and How to Avoid Them in “Guide to TradingView backtesting”
Even with the most thorough Guide to TradingView backtesting, there are pitfalls that can skew your results or mislead you into trading an unreliable strategy. Below are some of the most common issues and tips to mitigate them.
Overfitting
Overfitting occurs when you tweak a strategy’s parameters so extensively that it performs exceptionally well on historical data but fails to generalize to future conditions.
- Solution: Test across multiple time periods and avoid making extreme adjustments that only work for a specific data sample.
Data Snooping Bias
Sometimes, traders subconsciously pick data periods that favor their strategy. This can create an illusion of success.
- Solution: Randomize your data range or use entire market cycles. Avoid picking start and end dates specifically to highlight your strategy’s strengths.
Ignoring Fees and Slippage
If you trade on exchanges or brokers that charge commissions, these costs can significantly reduce net profit. Slippage (the difference between expected and executed prices) further impacts real results.
- Solution: Adjust your Strategy Settings to include a realistic commission rate. Factor in a few ticks of slippage for each trade, especially if you trade volatile markets.
Failing to Test Different Market Phases
A strategy might thrive in a trending market but implode when conditions turn choppy.
- Solution: Ensure your backtest spans bullish, bearish, and sideways periods.
Too Small a Sample Size
Backtesting on only a few trades or on a short historical time frame can be misleading.
- Solution: Look for strategies that have at least 50-100 trades in the backtest. More trades generally mean more statistically reliable results.
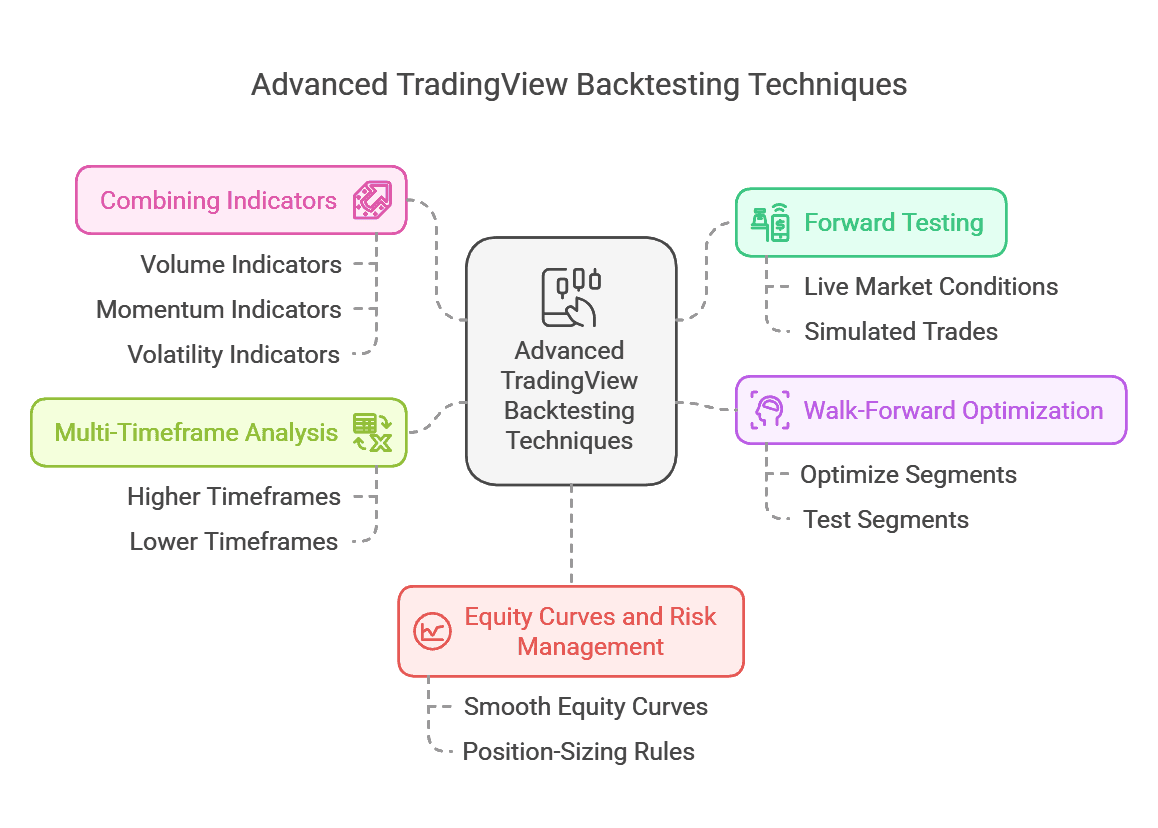
Advanced Tips for Optimizing Your “Guide to TradingView backtesting”
If you’ve got the basics down, here are some advanced techniques to take your Guide to TradingView backtesting further.
Forward Testing (Paper Trading)
After you identify a promising strategy, the next step is to “paper trade” in real-time. Paper trading simulates trades without risking real money:
You’ll see how the strategy handles live market conditions including sudden news events or liquidity issues that historical data can’t always reflect.
Walk-Forward Optimization
Walk-Forward Optimization
Instead of optimizing your strategy on a single historical period, walk-forward optimization breaks your dataset into multiple segments:
- Optimize on the first segment,
- Test on the second segment.
- Move forward through subsequent segments to see how well the optimized parameters from the first segment hold up in new data.
This process helps detect overfitting more accurately.
Multi-Timeframe Analysis
Many successful traders consider signals from higher timeframes for overall market direction, then refine entries on lower timeframes. For instance:
- Use the daily timeframe to decide on a bullish or bearish stance.
- Drop down to the 4-hour or 1-hour timeframe for precise entries.
Combining Indicators
While a single indicator (like a moving average crossover) can be helpful, consider combining it with:
- Volume Indicators (e.g., On-Balance Volume),
- Momentum Indicators (e.g., RSI, Stochastic),
- Volatility Indicators (e.g., Bollinger Bands),
to create confluence. But remember to keep it uncluttered; too many indicators can lead to confusion and overfitting.
Equity Curves and Risk Management
Look at your equity curve (cumulative profits over time). Is it steadily rising, or is it extremely volatile with large swings?
- Strategies with smooth equity curves might be easier to trade emotionally.
- Investigate position-sizing rules (like fixed fraction, fixed dollar, or volatility-based sizing). Proper risk management can drastically reduce drawdowns.
Conclusion: Mastering the “Guide to TradingView backtesting” for Ongoing Success
Guide to TradingView backtesting goes well beyond merely pressing a few buttons to see if you could have turned a profit in the past. It’s a dynamic, evolving process that challenges you to refine your strategies, acknowledge market changes, and incorporate realistic assumptions about fees, slippage, and drawdown tolerances.
By taking the time to fully understand TradingView’s features like the Strategy Tester panel, Pine Script environment, and various performance metrics you lay a strong foundation for successful trading.
Armed with the knowledge of avoiding pitfalls such as overfitting and data snooping bias, you can create, test, and optimize robust strategies that stand a better chance of withstanding the real-world volatility of financial markets. Remember that backtesting is never a one-and-done deal; it’s an ongoing practice that helps you remain adaptive and confident as you face ever-shifting market dynamics.
Ready to master backtesting?
Explore the best TradingView strategies & backtests on TradeSearcher and give your backtesting journey the best headstart possible!
You'll also like

Reading about strategies is step one
Answer a few questions and get matched with backtested strategies that fit your style.