Table of Content
BTCUSDT: The Ultimate Guide to Bitcoin/USDT Trading + 3 Backtest Examples
By Vincent Nguyen
Updated 535 days ago
1. Mastering BTC/USDT: A Complete Guide to Bitcoin & Tether Trading
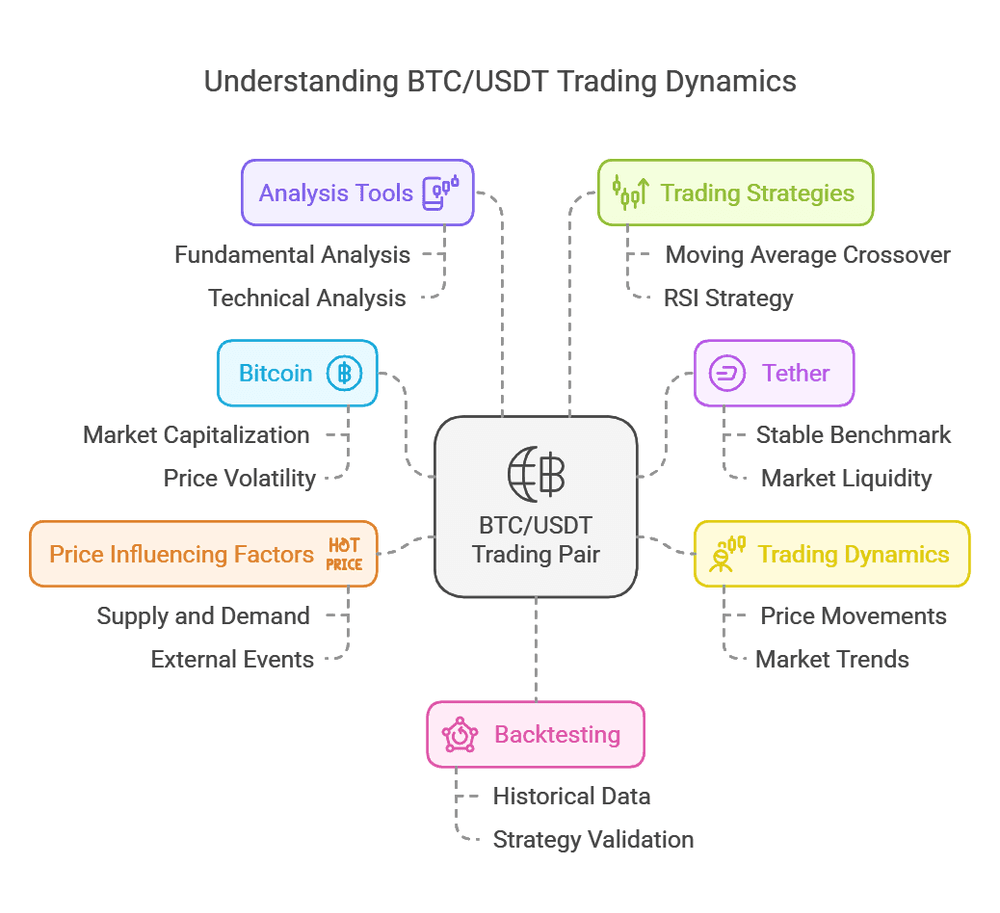
The cryptocurrency market has grown at a remarkable pace over the past decade, with Bitcoin (BTC) at the forefront of this revolution. Bitcoin was the first digital currency to gain mainstream recognition, and it continues to maintain the largest market capitalization in the crypto space. However, because of price volatility and the desire for stable benchmarks, many crypto traders prefer to denominate their trades in stablecoins. Of these stablecoins, Tether (USDT) is one of the most popular.
The BTC/USDT trading pair, which denotes the price of one Bitcoin in terms of USDT, has become a crucial benchmark for traders looking to gain or reduce exposure to Bitcoin using a digital stable asset. In this in-depth article, you will learn about Bitcoin and Tether, understand the dynamics of the BTC/USDT pair, explore factors influencing price movements, and discover tools and strategies to analyze and trade this pair. Additionally, we will provide three comprehensive backtest examples that illustrate how different strategies might have performed historically.
By the end of this article, you should have a solid understanding of both the fundamental and technical underpinnings of BTC/USDT, along with actionable insights into how backtesting can help validate a trading approach. Whether you’re a novice or an experienced trader, grasping the nuances of BTC/USDT can help you navigate the crypto market more effectively.
2. What is Bitcoin?
Bitcoin is a decentralized digital currency that operates on a peer-to-peer network, launched in 2009 by an individual or group under the pseudonym “Satoshi Nakamoto.” Unlike traditional fiat currencies, which are issued and regulated by central banks and governments, Bitcoin is maintained by a network of computers (nodes) running the Bitcoin software. Transactions are validated by miners who compete to solve complex cryptographic puzzles, a process known as Proof of Work (PoW).
Key Features of Bitcoin
Decentralization: No single authority, like a central bank, controls Bitcoin’s issuance or its transactional system. Instead, it is governed by its open-source protocol and the consensus of its network participants. Scarcity: Bitcoin has a finite supply of 21 million coins, which makes it a deflationary asset in contrast to fiat currencies that can be printed at will. The reward for mining is halved every 210,000 blocks (approximately every four years), leading to a decreasing supply growth rate over time. Security: Transactions are recorded on a distributed ledger called the blockchain. Once a block of transactions is added to the chain, altering it becomes computationally expensive and highly improbable. Immutability: The blockchain ledger is immutable, meaning once data has been recorded and verified, it cannot be changed retroactively without the consensus of the network. Global Accessibility: Bitcoin operates on the internet and is not limited by geographical borders. Anyone with an internet connection can access the network and send or receive Bitcoin.
Why Bitcoin is Popular
Bitcoin’s popularity stems from its pioneering status as the first cryptocurrency, coupled with its potential for significant price appreciation. Over the years, Bitcoin’s meteoric rise in value despite notable volatility has attracted both long-term investors and short-term traders. Many consider Bitcoin a store of value, akin to digital gold, while others view it as a speculative asset that can yield substantial gains.
3. What is Tether (USDT)?
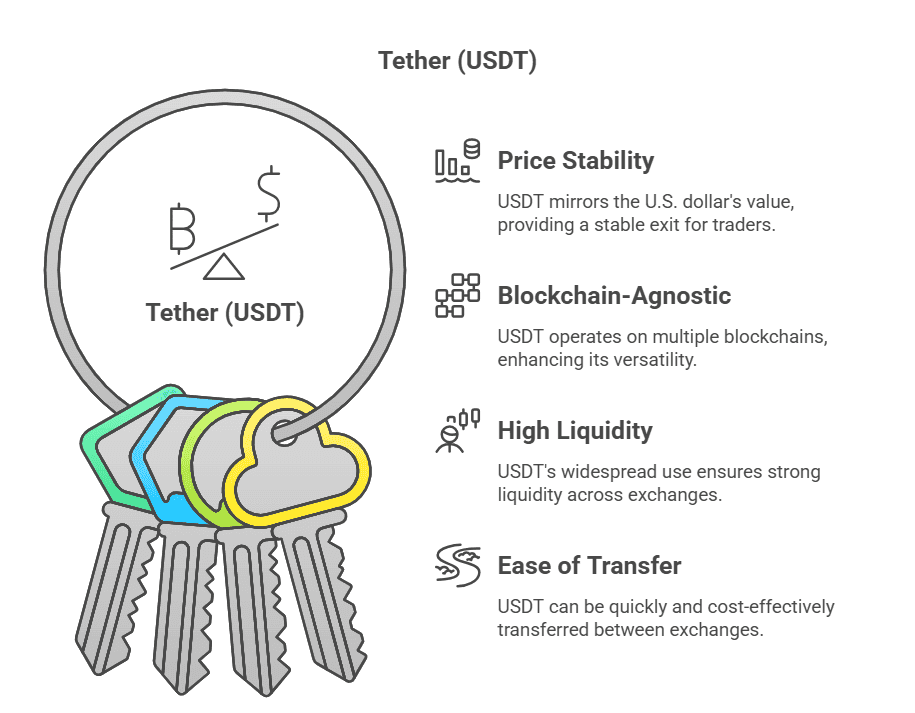
Tether (USDT) is a stablecoin issued by Tether Limited, designed to maintain a 1:1 peg with the U.S. dollar. The idea behind USDT is to offer a digital asset that avoids the volatility typically associated with cryptocurrencies. USDT is backed by reserves that Tether Limited claims to hold in various assets, including cash, cash equivalents, and other receivables.
Key Features of Tether
- Price Stability: USDT is meant to mirror the value of the U.S. dollar closely. This relative stability provides traders with a “safe harbor” to exit the volatility of other cryptocurrencies without converting back to fiat.
- Blockchain-Agnostic: Initially launched on the Omni Layer (Bitcoin’s protocol), Tether now exists on multiple blockchains, including Ethereum (ERC-20), Tron (TRC-20), and others.
- High Liquidity: Because USDT is the most widely used stablecoin by trading volume, it has strong liquidity across most major crypto exchanges.
- Ease of Transfer: USDT can be transferred quickly between exchanges, often at low cost depending on the blockchain network used.
Controversies and Considerations
Despite USDT’s widespread usage, Tether has faced scrutiny over its reserves and auditing practices. Critics argue that Tether Limited has not provided transparent, detailed audits showing that each USDT is fully backed by U.S. dollars or equivalent assets at all times. However, Tether continues to dominate the stablecoin market, in part due to convenience and widespread adoption on major exchanges.
4. Significance of the BTC/USDT Trading Pair
When you see “BTC/USDT” on an exchange, it represents how many USDT (i.e., how many U.S. dollar equivalents) are required to buy one BTC. This pair is one of the most traded cryptocurrency pairs globally and serves as a critical gateway for traders and investors.
Why BTC/USDT is Important
- Price Benchmark: Because USDT is pegged to the dollar, BTC/USDT effectively mirrors the BTC/USD trading price. This makes it a natural choice for traders who want to measure Bitcoin’s price in dollar terms without needing actual USD.
- Accessibility: People worldwide can trade BTC/USDT without going through banks or fiat on-ramps, especially in regions where banking restrictions hamper fiat-to-crypto conversions.
- High Liquidity: BTC/USDT pairs typically have deep order books on most exchanges, allowing for fast execution and minimal slippage for large orders.
- Stable Refuge: Traders often convert their Bitcoin into USDT during volatile market conditions to “lock in” gains or protect against downside moves, avoiding the hassle of withdrawing funds to a bank account.
The strong liquidity and near-universal presence of BTC/USDT across crypto exchanges ensure that it remains one of the most transparent and closely watched trading pairs. As a result, mastering the BTC/USDT pair gives you a well-rounded view of the broader Bitcoin market.
5. Key Factors Influencing BTC/USDT Price Movements
Although USDT is relatively stable, Bitcoin is highly volatile. The BTC/USDT price essentially fluctuates based on factors affecting Bitcoin’s supply and demand, as USDT usually maintains its $1 peg. Here are some of the primary influences on BTC/USDT price movements:
- Market Sentiment: Positive news stories, institutional adoption, or endorsements by influential figures can drive demand for Bitcoin, pushing its price higher. Conversely, regulatory crackdowns or negative press can dampen sentiment and lower the price.
- Macroeconomic Factors: Global economic conditions, interest rates, and monetary policies can indirectly influence Bitcoin’s appeal as an alternative store of value, thus affecting demand.
- Mining Difficulty and Halving Events: Bitcoin’s block reward halving, which occurs roughly every four years, reduces the mining reward and often sparks new waves of interest and price speculation.
- Network Fundamentals: On-chain metrics such as hash rate, active wallet addresses, and transaction volumes can signal changes in user adoption or miner participation.
- Regulatory Environment: Government policies, bans, or friendly legislation around Bitcoin and stablecoins significantly impact market participation and liquidity.
Because Tether itself has been subject to regulatory scrutiny, any controversy or doubt around Tether’s reserves could momentarily affect the BTC/USDT pair, typically seen as fluctuations in the USDT peg. However, for most day-to-day trading, the main driver remains Bitcoin’s price volatility.
6. Where to Trade BTC/USDT
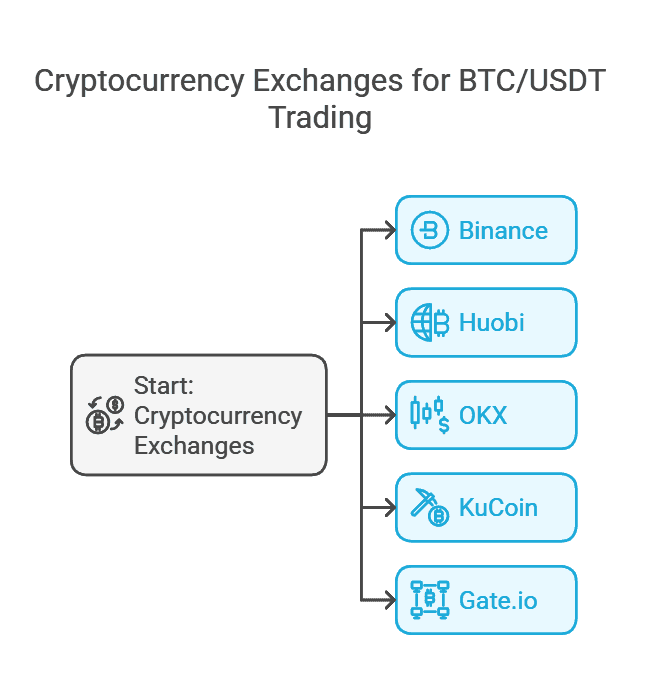
Numerous cryptocurrency exchanges offer BTC/USDT trading due to the pair’s high volume. Popular platforms include:
- Binance: One of the largest crypto exchanges by volume, offering multiple trading pairs and advanced features.
- Huobi: Another global exchange with a wide array of trading tools and deep liquidity for BTC/USDT.
- OKX: Known for its liquidity and advanced order types, also supporting a robust derivatives market.
- KuCoin: A platform offering a balance between user-friendly features and advanced trading tools, including high liquidity for BTC/USDT.
- Gate.io: Features a variety of altcoins in addition to BTC/USDT, appealing to traders looking to diversify.
When choosing an exchange, factors such as security, fees, user interface, and regulatory compliance in your jurisdiction are important considerations. Some exchanges require stricter KYC (Know Your Customer) processes than others, which may impact how quickly you can start trading or withdraw funds.
7. How to Analyze BTC/USDT
Analyzing the BTC/USDT pair typically involves a blend of fundamental and technical analysis. Because Bitcoin is its own ecosystem with unique indicators and metrics (such as on-chain data), traders often look beyond traditional market signals.
Fundamental Analysis (FA)
Fundamental analysis for Bitcoin includes examining on-chain metrics (hash rate, active addresses, transaction volume), regulatory developments, macroeconomic trends, and technological upgrades (e.g., Taproot, Lightning Network enhancements). For Tether, the primary “fundamental” factor is confidence in Tether’s peg to the U.S. dollar.
- On-Chain Data: Platforms like Glassnode, CryptoQuant, and Coin Metrics provide real-time data on Bitcoin’s network.
- Mining Metrics: Hash rate and difficulty can indicate network security and miner sentiment.
- Development Roadmap: Community consensus around upgrades, forks, and improvements can influence long-term price trends.
Technical Analysis (TA)
Technical analysis involves using price charts, volume data, and various indicators to predict future price movements. Commonly used techniques include:
- Candlestick Patterns: Candlestick charts reveal short-term price momentum, key support/resistance levels, and potential reversals.
- Moving Averages (MAs): Simple Moving Averages (SMA) or Exponential Moving Averages (EMA) help traders gauge trends.
- Relative Strength Index (RSI): Identifies overbought or oversold conditions.
- Bollinger Bands: Helps gauge price volatility and potential breakout points.
- MACD (Moving Average Convergence Divergence): Measures momentum and possible trend reversals.
- Volume Analysis: Confirms the strength of price movements; strong moves often come with high volume.
A combination of FA and TA often yields the most robust trading decisions, especially in a market as dynamic as cryptocurrency.
8. Common Trading Strategies for BTC/USDT
Before diving into the backtest examples, it’s crucial to understand the types of strategies that traders commonly apply to BTC/USDT.
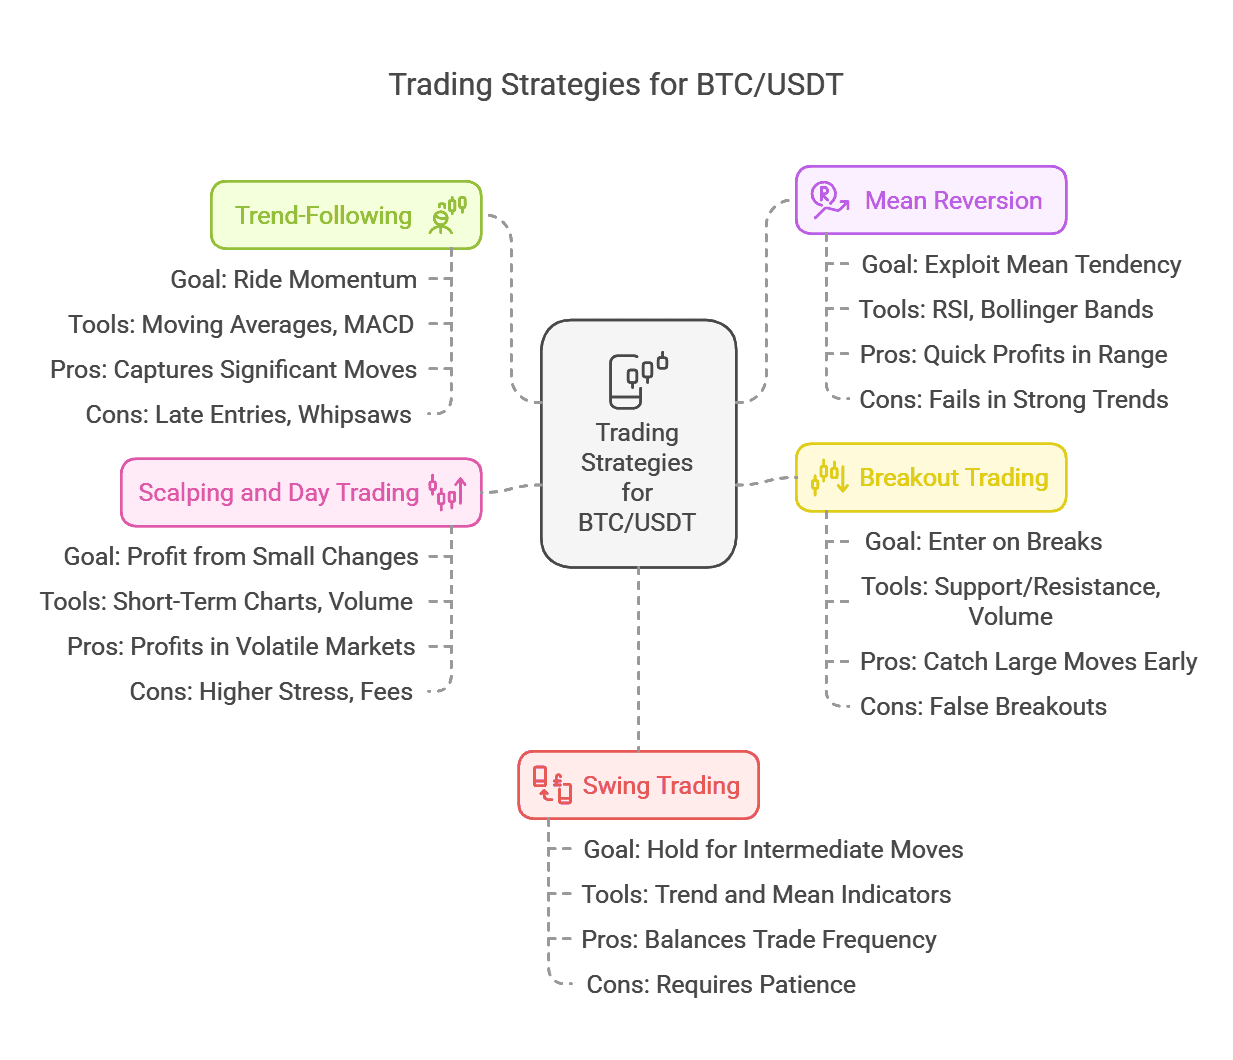
1. Trend-Following
Goal: Ride the momentum of the market. Tools: Moving averages, MACD, trend lines. Pros: Potentially captures significant price moves. Cons: Can lead to late entries/exits and whipsaws in choppy markets.
2. Mean Reversion
Goal: Exploit the tendency of prices to revert to a mean or average price over time. Tools: RSI, Bollinger Bands, and other oscillators. Pros: Can capture quick profits in sideways or range-bound markets. Cons: Fails badly if the market breaks out into a strong trend.
3. Breakout Trading
Goal: Enter positions during sudden breaks of key support/resistance levels or chart patterns (e.g., triangles, rectangles). Tools: Support/resistance lines, volume indicators, pivot points. Pros: Can catch large moves early. Cons: False breakouts can trigger stop losses.
4. Scalping and Day Trading
Goal: Profit from small price changes during intraday sessions. Tools: Very short-term charts (1-minute to 15-minute), volume spikes, order flow. Pros: Can yield profits in volatile markets multiple times a day. Cons: Higher stress, potentially higher fees from frequent trades.
5. Swing Trading
Goal: Hold positions for days or weeks to catch intermediate price moves. Tools: Combination of trend-following and mean reversion indicators on 4-hour to daily charts. Pros: Balances frequency of trades with larger price movements. Cons: Requires patience and accurate entry/exit timing.
9. Backtesting Basics
Before risking real capital, traders often use backtesting to see how a strategy would have performed using historical data. Backtesting involves taking a set of trading rules buy and sell signals and applying them to past market conditions to simulate trades and outcomes.
Why Backtest?
Validation: Helps validate the logic and feasibility of a trading strategy. Optimization: Allows tweaking of parameters (e.g., moving average lengths) to find better results. Risk Assessment: Gives insight into risk metrics like drawdown, win/loss ratio, and volatility.
Caveats and Limitations
Overfitting: Tailoring a strategy too closely to historical data might result in poor future performance. Market Changes: Past market conditions can be drastically different from future conditions (e.g., regulatory changes, macroeconomic shifts). Data Quality: Reliable historical data is critical. Inaccurate or incomplete data can render backtest results meaningless.
10. Backtest Example #1: Moving Average Crossover Strategy
Strategy Overview
One of the most straightforward trend-following approaches is the moving average crossover. The idea is to buy when a short-term moving average crosses above a longer-term moving average (indicating a potential uptrend) and sell or short when the short-term moving average crosses below the longer-term moving average (indicating a potential downtrend).
Indicator Parameters:
- Short-Term MA: 50-period Exponential Moving Average (EMA)
- Long-Term MA: 200-period Exponential Moving Average (EMA)
Trading Rules
- Buy (Long) Signal: Occurs when the 50-EMA crosses above the 200-EMA.
- Sell (Exit Long) Signal: Occurs when the 50-EMA crosses back below the 200-EMA.
To keep it simple, we won’t shorten this example. We’ll only go long when the crossover is bullish, and we’ll exit that long position when the crossover turns bearish.
Timeframe and Data
- Timeframe: Daily chart
- Data Range: Let’s assume we’re using a five-year historical period from 2018 to 2022.
Backtest Results (Hypothetical Summary)
- Number of Trades: 9
- Winning Trades: 5
- Losing Trades: 4
- Net Profit: +120% (compounded over five years; hypothetical figure)
- Max Drawdown: -35%
The moving average crossover strategy performed relatively well during strong uptrends, especially in the bull runs. However, it got whipsawed during choppy sideways periods, leading to small losses. The overall net profit is still quite attractive, primarily driven by capturing major bullish trends in Bitcoin from late 2020 to early 2021.

11. Backtest Example #2: RSI Overbought/Oversold Strategy
Strategy Overview
The Relative Strength Index (RSI) measures the speed and change of price movements. Its values range from 0 to 100, with readings above 70 traditionally seen as overbought and readings below 30 seen as oversold. A simple mean reversion strategy might be to buy when RSI goes below 30 and crosses back above 30, and sell when RSI goes above 70 and crosses back below 70.
Indicator Parameters:
- RSI Length: 14 periods
Trading Rules
- Buy (Long) Signal: Triggered when the RSI dips below 30 and then moves back above 30, indicating a recovery from oversold conditions.
- Sell (Exit Long) Signal: Triggered when the RSI rises above 70 and then falls back below 70, indicating a reversal from overbought conditions.
Like the first example, we’ll stick to long-only trades to simplify the demonstration.
Timeframe and Data
- Timeframe: 4-hour chart
- Data Range: Let’s hypothetically use data from 2019 to 2022.
Backtest Results (Hypothetical Summary)
- Number of Trades: 25
- Winning Trades: 16
- Losing Trades: 9
- Net Profit: +85% (over three years; hypothetical figure)
- Max Drawdown: -40%
The RSI strategy generally capitalized on quick snapbacks from oversold levels, especially in short-term downtrends or corrections during bull markets. However, during prolonged bear markets, the RSI could remain oversold for extended periods, leading to a series of small losses if the price continued to drop.
Key Takeaways
Mean reversion works well in choppy or sideways markets, yielding repeated small gains.
It can struggle if the price enters a sustained downtrend (or uptrend) without frequent pullbacks.
Using a 4-hour timeframe allowed for more frequent signals, hence more trades overall compared to the daily chart.
12. Backtest Example #3: Breakout Strategy
Strategy Overview
A breakout strategy aims to capture a significant move once the price breaks through a well-defined support or resistance level. Traders often set entry orders just above resistance (for a buy) or below support (for a short). For this example, we’ll consider a classic range breakout system.
Indicator/Setup:
- Identify a price range or consolidation channel using horizontal support and resistance lines on the daily chart over a 10-day period.
Trading Rules
- Buy (Long) Signal: If price closes above the 10-day highest high, enter a long position the next day.
- Sell (Exit Long) Signal: If price closes below the 10-day lowest low (while in a long), exit the position.
We’ll assume no shorting here, focusing solely on upward breakouts.
Timeframe and Data
- Timeframe: Daily chart
- Data Range: 2017 to 2022 (includes multiple bull and bear cycles for Bitcoin).
Backtest Results (Hypothetical Summary)
- Number of Trades: 12
- Winning Trades: 4
- Losing Trades: 8
- Net Profit: +160% (over five years; hypothetical figure)
- Max Drawdown: -50%
Although the number of winning trades is relatively small, the winners were massive—the strategy caught large portions of Bitcoin’s major bull runs. The losing trades, which were more frequent, tended to be relatively small, as the exit rule triggered quickly if the breakout failed.
Key Takeaways
Breakout strategies can yield large wins when price follows through strongly.
They suffer multiple small losses in sideways markets with frequent false breakouts.
Volatile assets like Bitcoin can sometimes trigger breakouts only to reverse course, so stop-loss placement and position sizing are crucial.
13. Risk Management and Best Practices
Regardless of the strategy, managing risk is paramount. Bitcoin’s volatility, while offering big opportunities, can also result in rapid losses if not approached carefully.
- Position Sizing: Risk only a small percentage of your trading capital (e.g., 1-2%) per trade.
- Stop-Loss Orders: Always have a clear exit plan if the market moves against you.
- Diversification: Avoid concentrating all your funds in a single asset or strategy.
- Leverage Caution: Leverage amplifies both profits and losses. Over-leveraging is a common pitfall among crypto traders.
- Continuous Evaluation: Regularly review your strategy’s performance, considering changing market conditions.
Implementing robust risk management can spell the difference between a sustainable trading career and a series of catastrophic losses.
14. Security Considerations
When dealing with BTC/USDT, you must also consider how and where you store your crypto:
- Use Secure Exchanges: Check for security features like cold storage, two-factor authentication (2FA), and regulatory compliance.
- Enable 2FA: Every account holding your funds should be protected by 2FA apps (e.g., Google Authenticator).
- Hardware Wallets: For longer-term holdings of BTC, consider transferring them to a hardware wallet (e.g., Ledger or Trezor) to minimize risk of hacking.
- Strong Passwords: Use unique, complex passwords for each account.
Because Tether is an ERC-20 or TRC-20 token (among other versions), ensure that if you transfer USDT to a private wallet, you send it to the correct blockchain network address.
15. Future Outlook
The future of the BTC/USDT trading pair largely hinges on two key factors: Bitcoin’s ongoing adoption and Tether’s stability as a leading stablecoin. Despite occasional regulatory hurdles, Bitcoin’s network effect and first-mover advantage continue to attract institutional interest. On the stablecoin front, Tether has competitors (like USDC, BUSD, and DAI), but it remains the most liquid stablecoin for now.
Potential Developments
- Institutional Adoption: As more institutions hedge funds, investment banks, and corporations adopt Bitcoin, trading volumes for BTC/USDT could continue to surge.
- Regulatory Frameworks: Global regulatory clarity around stablecoins, including Tether, will likely shape investor confidence. Greater transparency could either strengthen Tether’s position or open the door for alternatives.
- Technical Upgrades: Ongoing improvements to Bitcoin’s scalability (e.g., Lightning Network) can enhance its utility as a medium of exchange, potentially boosting demand.
- DeFi and Layer-2 Solutions: Growth in decentralized finance (DeFi) may integrate Bitcoin through wrapped tokens or second-layer solutions, potentially affecting BTC/USDT arbitrage and liquidity flows across different blockchain ecosystems.
Ultimately, Bitcoin’s role as a digital store of value and Tether’s role as a stable trading benchmark are likely to persist. While the pair might evolve as the crypto landscape changes, BTC/USDT is expected to remain a mainstay for traders.
Conclusion
BTC/USDT is one of the most actively traded pairs in the cryptocurrency market, offering traders a near-seamless way to gain exposure to Bitcoin’s price movements while using Tether’s price stability as a base currency. By understanding the fundamentals of Bitcoin, the role of Tether as a stablecoin, and the factors that drive price action, traders can gain a deeper appreciation for the pair’s dynamics.
Moreover, analyzing the BTC/USDT market involves both fundamental analysis (looking at Bitcoin’s on-chain metrics, adoption trends, and macroeconomic contexts) and technical analysis (examining price charts, indicators, and trading patterns). While no one strategy guarantees success, backtesting strategies like moving average crossovers, RSI mean reversion, and breakout setups can provide historical insights into potential performance.
That said, the risks associated with Bitcoin’s volatility and the need for robust risk management cannot be overstated. Always size your positions responsibly and use stop-loss orders to protect against adverse market moves. Additionally, consider using secure exchanges and wallets to safeguard your assets from the ever-present risk of hacking and scams.
Looking to refine your BTC/USDT trading strategy? 🚀
TradeSearcher helps you analyze and backtest thousands of trading strategies to find the best-performing ones. Leverage AI-powered insights to optimize your trades—start exploring today! Try TradeSearcher now 🔍📊
You'll also like
Reading about strategies is step one
Answer a few questions and get matched with backtested strategies that fit your style.