Table of Content
Best Indicators for Swing Trading: A Beginner's Guide to Profitable Trades
By Vincent Nguyen
Updated 540 days ago
Best indicators for swing trading
Best indicators for swing trading can make a significant difference when attempting to capture profits over several days or weeks. Swing trading focuses on identifying price “swings” within an ongoing trend, allowing traders to profit from short- to medium-term fluctuations. Unlike day trading, which demands rapid entries and exits within the same day, swing trading allows more time to analyze price movements and technical signals before making decisions.
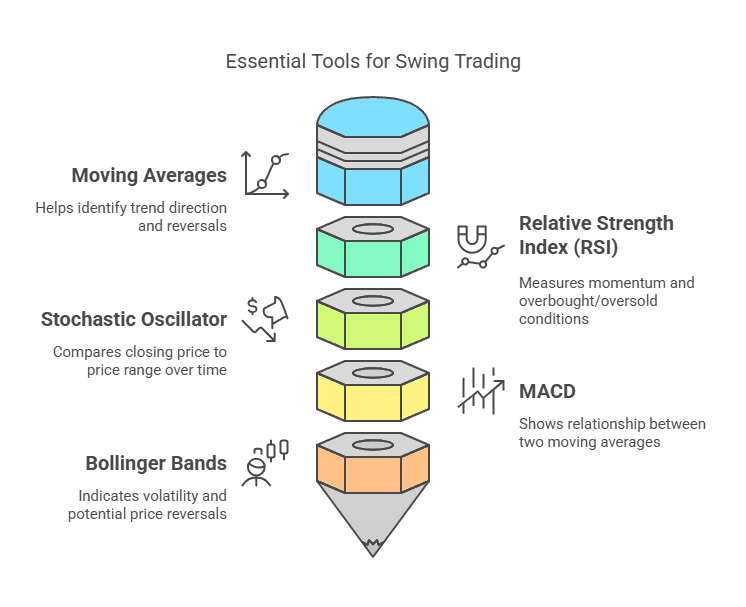
In this guide, we’ll break down the fundamentals of swing trading, explore the best indicators for swing trading, and show you how to combine them effectively. We’ll discuss why having the right indicators matters, look at five powerful tools (Moving Averages, RSI, Stochastic Oscillator, MACD, and Bollinger Bands), and cover additional tips and common mistakes. By the end, you’ll be better equipped to spot potential trends, filter out market noise, and develop a more strategic approach to your trades.
Understanding the basics of swing trading
Swing trading lies between the short bursts of day trading and the long holding periods of buy-and-hold investing. Typically, swing traders aim to capture price moves that last anywhere from a couple of days to a few weeks. These moves often occur within a larger trend, but they can also happen in range-bound or volatile markets.
- Timeframes: Swing traders frequently use 4-hour, daily, or weekly charts, depending on their strategy. These timeframes offer enough data to spot meaningful price shifts while filtering out much of the noise that day traders see on 1-minute or 5-minute charts.
- Market momentum: One of the core principles of swing trading is capturing momentum in the market. If a stock, currency pair, or crypto asset is trending upward, swing traders look for pullbacks (short-term dips) to enter and ride the next upswing. Conversely, in a downward trend, they may look for small rallies (temporary upward moves) to open short positions.
- Comparison to day trading: Day traders typically close all positions before the market session ends, relying heavily on intraday charts and fast execution. Swing traders, in contrast, can hold positions overnight or through minor market corrections. This approach can be less stressful for those with full-time jobs or busy schedules because trades unfold more gradually.
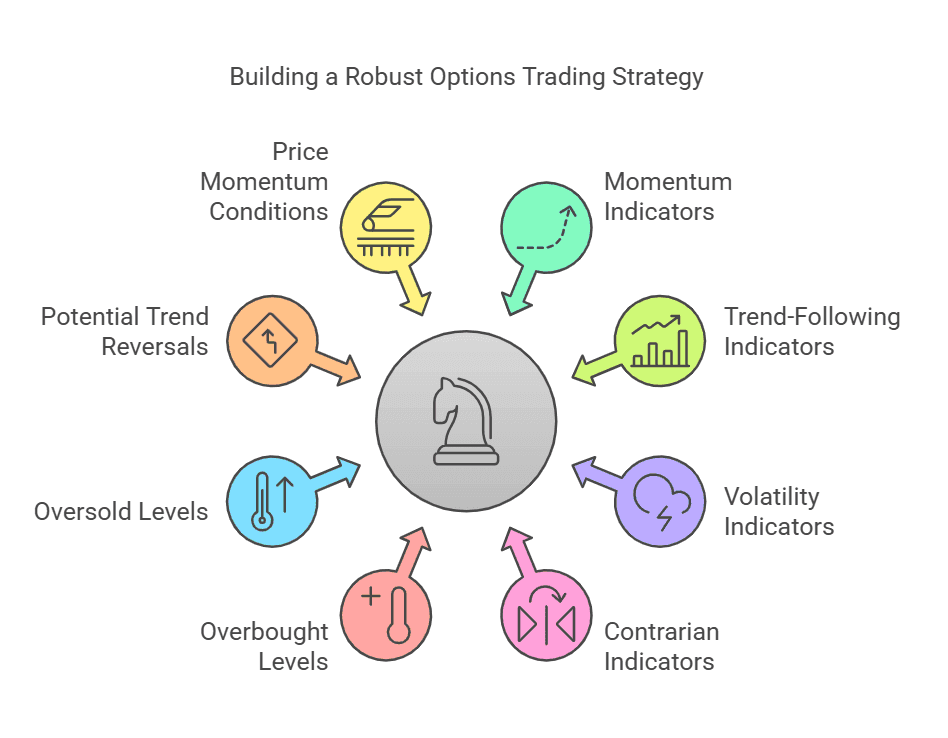
Why the right trading indicators matter
Selecting the right trading indicators can be a game-changer. Indicators are mathematical calculations based on price (and sometimes volume) that help you interpret and forecast market behavior. Especially in swing trading, these tools filter out random price fluctuations and highlight potential entry and exit points.
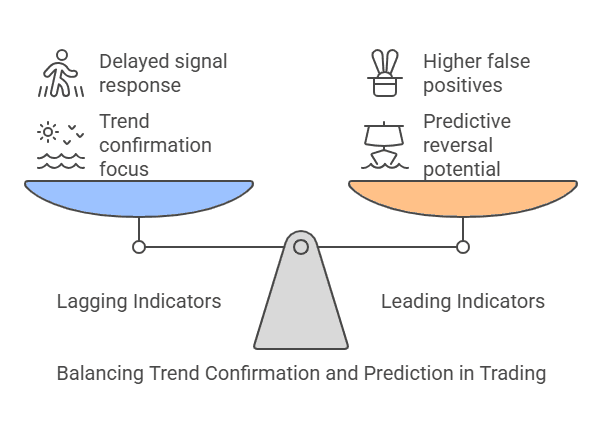
Lagging vs. leading indicators
- Lagging indicators: Often based on past price data, they’re typically used to confirm an existing trend. Moving Averages (MA) and Moving Average Convergence Divergence (MACD) fall into this category. They’re excellent for spotting the overall direction of the market but can delay signals in rapidly changing conditions.
- Leading indicators: Tools like the Relative Strength Index (RSI) and the Stochastic Oscillator can signal potential changes or reversals before they become evident in the price action. However, they may produce more false positives if used without proper confirmation.
Importance of confirmation
- Avoid relying on a single indicator: Each indicator tells a slightly different story. Combining multiple signals can provide a clearer picture. For instance, if a leading indicator like RSI shows overbought conditions but a lagging indicator like a Moving Average confirms a strong uptrend, you might wait for further confirmation before entering or exiting a trade.
- Reducing market “noise”: Indicators help cut through short-term volatility, highlighting genuine shifts in momentum or trend.
Best indicators for swing trading #1: Moving Averages
Moving Averages stand as one of the best indicators for swing trading due to their simplicity and effectiveness. They smooth out price data over a specified period, revealing the underlying direction of a security.
Key Features of Moving Averages
- Simple Moving Average (SMA): An SMA calculates the average closing price of an asset over a specific time frame (e.g., 50, 100, or 200 days). It gives equal weight to all data points in that period, making it straightforward but sometimes slower to react to recent price changes.
- Exponential Moving Average (EMA): An EMA places more weight on the most recent price data, allowing it to respond more quickly to price fluctuations. Because of this, swing traders may prefer the EMA for more timely signals, especially if the market experiences rapid shifts.
How to Interpret Signals
- Crossover strategy: When a shorter-term MA (e.g., 50-day) crosses above a longer-term MA (e.g., 200-day), it can signal a bullish trend (often called the “golden cross”). Conversely, a bearish crossover, or “death cross,” occurs when the shorter-term MA falls below the longer-term MA.
- Dynamic support and resistance: Moving Averages can act as support or resistance. For example, in an uptrend, the price might bounce off the 50-day EMA multiple times, indicating strong buying pressure at that line.
- Trend confirmation: Many swing traders wait for the price to be on one side of a key MA (e.g., the 200-day) to confirm the market’s bullish or bearish stance.
Moving Averages are versatile. Whether you’re looking at a 20-day EMA for short-term trades or a 200-day SMA to confirm a broader trend, incorporating them into your swing trading strategy often helps with clearer buy and sell signals.
2 Moving Averages | Trend Following
This trend-following strategy harnesses a duo of moving averages (fast and slow) alongside the Parabolic SAR indicator to track and confirm market trends. Buy signals occur when the fast MA crosses above the slow MA with the current price over the fast MA; sell signals are the inverse. Stop-loss levels are calculated using the Average True Range (ATR) to manage risk efficiently. It offers flexibility to enter or exit positions and to conduct backtesting over selected date ranges.
2 Moving Averages | Trend Following
Gold (XAUUSD)
@ 15 min
1.21
Risk Reward91.28 %
Total ROI149
Total TradesBest indicators for swing trading #2: Relative Strength Index (RSI)
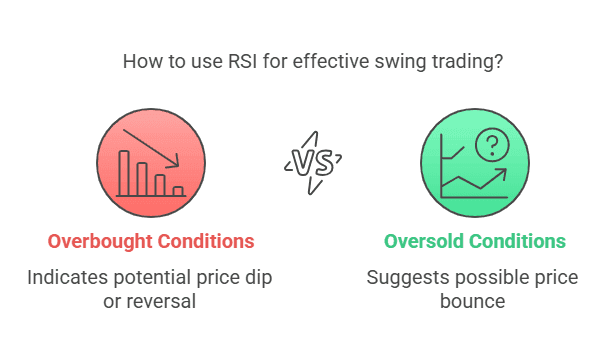
RSI is a momentum oscillator and another one of the best indicators for swing trading. It measures the speed and change of recent price movements, oscillating between 0 and 100. Typically, a reading above 70 suggests overbought conditions, while a reading below 30 indicates oversold conditions.
Key Features of RSI
- Calculation: RSI compares the magnitude of recent gains to recent losses, creating a ratio that displays the market’s momentum. The standard setting is 14 periods.
- Overbought and oversold zones: The 70/30 thresholds are defaults. Some traders adjust these levels to 80/20 for more conservative signals, minimizing the risk of whipsaws in volatile markets.
How to Interpret RSI Signals
- Overbought/oversold: When RSI crosses above 70, some swing traders look for a potential price dip or reversal. Conversely, dipping below 30 can hint at an upcoming price bounce.
- Divergence: RSI divergence occurs when the indicator moves in the opposite direction of the price. For instance, if the price forms a new high but RSI fails to make a corresponding high, it may foreshadow a trend reversal.
- Swing rejections: Another RSI strategy is to wait for the RSI to climb above 70, dip back down, and then fail to break 70 on a subsequent rally—indicating a “swing rejection” and a potential move downward.
RSI is powerful because it can give early warnings of trend shifts, helping you enter or exit trades before the broader market reacts. However, like all indicators, it’s best combined with other tools or price action analysis for confirmation.
Best indicators for swing trading #3: Stochastic Oscillator
Stochastic Oscillator is another momentum-based tool and is widely regarded as among the best indicators for swing trading. It compares a stock’s closing price to its price range over a specific period, typically using the parameters (14, 3, 3). The output consists of two lines: %K and %D.
Key Features of the Stochastic Oscillator
- Overbought (80) and oversold (20): Similar to RSI, if the Stochastic lines move above 80, the market may be overbought. Below 20 indicates oversold.
- Sensitivity: A shorter setting (e.g., 5, 3, 3) will produce more frequent signals but can lead to more “noise.” A longer setting (14, 3, 3 or 21, 5, 5) may provide fewer but more reliable signals.
How to Interpret Stochastic Signals
- Crossovers: When the %K line crosses above the %D line in oversold territory, it can signal a potential bullish reversal. Conversely, a crossover in overbought territory can point to a bearish reversal.
- Divergence: Like RSI, if the price forms higher highs but the Stochastic forms lower highs, it suggests weakening momentum.
- Combining with other indicators: Traders often pair Stochastics with a trend indicator (e.g., a Moving Average) to confirm whether a bullish or bearish crossover aligns with the broader market direction.
The Stochastic Oscillator’s value lies in its responsiveness to price changes. While that agility can lead to false signals, it can also help pinpoint trades in timely fashion—particularly when used in conjunction with a more stable indicator.
Best indicators for swing trading #4: MACD
Moving Average Convergence Divergence (MACD) is a trend-following momentum indicator, and it’s frequently listed among the best indicators for swing trading because it visualizes both trend and momentum changes.
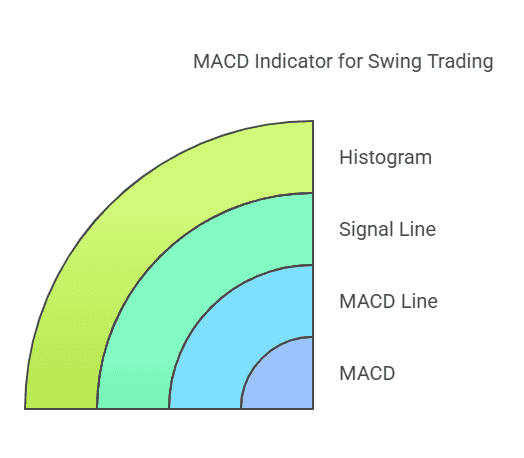
Key Components of MACD
- MACD line: Calculated by subtracting the 26-period EMA from the 12-period EMA (default settings).
- Signal line: Typically a 9-period EMA of the MACD line.
- Histogram: Shows the difference between the MACD line and the signal line. Positive values suggest bullish momentum, while negative values indicate bearish momentum.
How to Interpret MACD Signals
- Zero-line crossovers: When the MACD line crosses above zero, it often indicates a bullish shift in momentum. Dropping below zero suggests bearish momentum.
- Signal line crossovers: A bullish crossover occurs when the MACD line rises above the signal line, possibly triggering a swing entry. A bearish crossover occurs when the MACD line falls below the signal line.
- Divergence: If the MACD forms higher lows while the price makes lower lows, it suggests a potential bullish reversal is on the horizon (and vice versa for bearish divergence).
MACD offers a clear visual representation of whether momentum is building or waning. By pairing it with something like RSI or a Moving Average crossover, you can increase your confidence in your swing trading signals.
3C MACD & RSI Scalper no repaint
3C MACD & RSI Scalper no repaint is tailored for active scalping, utilizing 1, 5, or 15-min TFs, with live tweaking for optimal performance across currency pairs. It leverages MACD peaks and RSI for entry points without repainting, and suggests long/short positions using different MA types and lengths. Session filtering, particularly the EU, enhances results. The strategy integrates with 3commas bots for execution but does not require a 3c subscription.
Best indicators for swing trading #5: Bollinger Bands
Bollinger Bands stand out among the best indicators for swing trading for their ability to measure volatility. Created by John Bollinger, this indicator plots three lines: a Simple Moving Average (typically 20 periods) in the middle, with upper and lower bands usually set 2 standard deviations away from the SMA.
Key Features of Bollinger Bands
- Volatility measurement: When the market is volatile, the bands expand; during quieter times, they contract.
- Default settings: Many traders keep the 20-SMA with ±2 standard deviations, but these can be adjusted to suit different market conditions.
How to Interpret Bollinger Band Signals
- Bollinger Squeeze: When the bands tighten significantly, it indicates a period of low volatility, often a precursor to a strong breakout. Swing traders watch for price to close decisively above or below the bands to identify new trends.
- Mean reversion: Some strategies involve waiting for price to touch or exceed the upper band (potentially overbought) and then revert back toward the middle SMA. Conversely, a drop below the lower band may indicate an oversold condition.
Combining with momentum: If Bollinger Bands show a breakout and RSI confirms a shift from oversold to neutral, you may have a higher-probability swing setup.
BT-Bollinger Bands - Trend Following
The "BT-Bollinger Bands - Trend Following" strategy uses Bollinger Bands to signal trend initiation, setting entries when price action breaches and closes across band extremes—long on closing above the upper band, short on closing below the lower band. Exits are executed when price reverts to the band's mean. For enhanced precision, integrate a moving average as an additional filter or automate entries and exits with compatible bot services.
Combining the best indicators for swing trading
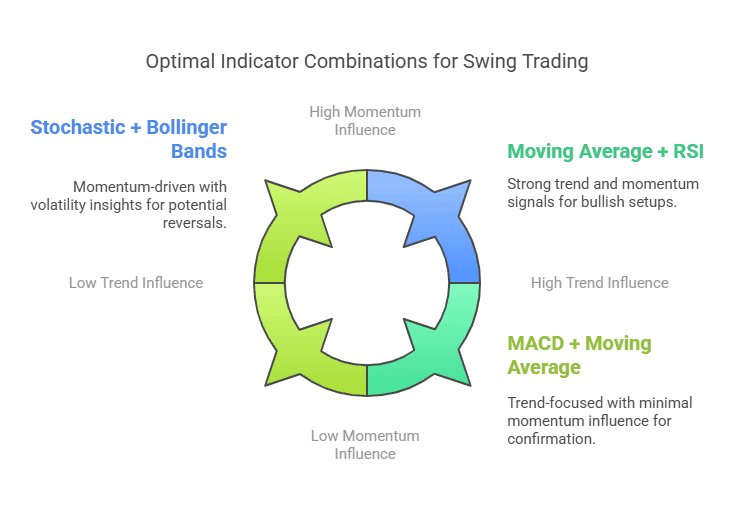
Using multiple indicators can provide a comprehensive view of market conditions, but it’s crucial not to overload your charts. Aim to blend a trend-following indicator (like a Moving Average or MACD) with a momentum indicator (like RSI or Stochastic) and possibly a volatility measure (like Bollinger Bands).
- Trend + Momentum: Combine Moving Averages (to identify the overall direction) with RSI or Stochastics (to gauge if an asset is overbought or oversold). If the price is above a 50-day SMA and RSI is crossing up from below 30, it could signal a bullish swing setup.
- Confirmation: Wait for alignment. For example, if Bollinger Bands show a squeeze (low volatility) and MACD is about to cross above its signal line, you have two indicators hinting at a possible bullish breakout.
- Avoid Analysis Paralysis: Too many indicators can generate conflicting signals. Focus on a small set of complementary tools. If you’re always adding more indicators to “be sure,” you might miss timely trades or become confused by contradictory data.
Additional tips for using the best indicators for swing trading
Here are a few practical pointers to get the most out of the best indicators for swing trading:
- Customize settings: Don’t assume default settings (e.g., RSI at 14, Bollinger Bands at 20, ±2 SD) are always optimal. Each market (stocks, forex, crypto) and each timeframe (4-hour, daily, weekly) can have different volatility profiles. Consider tweaking period lengths after backtesting.
- Use multiple timeframes: A daily chart might show a strong uptrend, but a 4-hour chart could reveal that the market is currently in a short-term pullback. By checking multiple timeframes, you can better time your entries.
- Risk management: No indicator can guarantee success if you ignore risk management. Always have a plan for stop losses, position sizing, and profit targets. Indicators can help you set stop losses—for example, placing a stop just below a key Moving Average or outside Bollinger Bands.
- Combine fundamentals when relevant: Swing trading is predominantly technical, but major economic announcements, earnings reports, or industry news can disrupt market behavior. Keep an eye on the economic calendar and corporate announcements that could impact your trades.
- Practice and backtest: Before risking real capital, practice on a demo account or backtest your strategy using historical data. This will help you refine indicator settings and build trust in your system.
Common mistakes to avoid in swing trading
Even with the best indicators for swing trading at your disposal, mistakes can still happen. Being aware of common pitfalls can save you from significant losses:
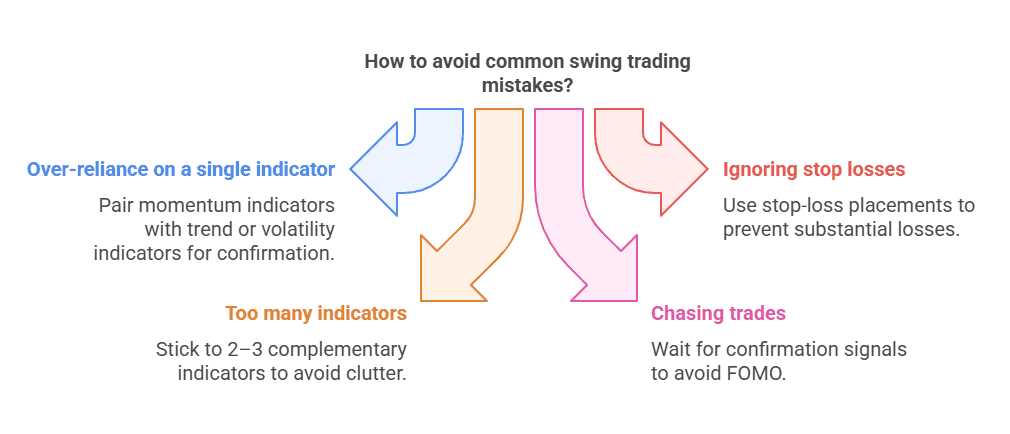
- Putting all your faith in one tool often leads to missing the bigger picture. Always pair momentum indicators with trend or volatility indicators for confirmation.
- Swing trading can involve holding positions overnight or longer. If the market gaps against you, the loss can be substantial without proper stop-loss placement.
- Using four or five indicators that all do the same job clutters your chart and mind. Stick to a core set of 2–3 that complement each other.
- If you see a sudden move, it’s tempting to jump in late. FOMO (fear of missing out) often leads to buying near tops or selling near bottoms. Trust your strategy and wait for confirmation signals.
- A short-term chart might scream “buy” while a longer-term chart shows a clear downtrend. Align your timeframes to avoid confusing, contradictory signals.
- Continuously tweaking indicator parameters after every loss (curve-fitting) can make your strategy look great in hindsight but fail in real-time trading. Instead, use a methodical approach and accept that no system works 100% of the time.
Conclusion: Summing up the best indicators for swing trading
In conclusion, best indicators for swing trading help traders more accurately gauge market direction, volatility, and momentum, making it easier to time entries and exits. Moving Averages offer a straightforward way to identify overall trends, RSI and Stochastics reveal potential overbought or oversold conditions, MACD illustrates shifts in momentum, and Bollinger Bands showcase volatility squeezes and breakouts. By using these tools in harmony—perhaps combining a trend indicator with a momentum oscillator—you can filter out random price fluctuations and focus on higher-probability setups. Keep in mind, however, that indicators are only as effective as the discipline and risk management that back them up. Through consistent practice, thorough backtesting, and sound risk controls, these indicators can serve as a solid foundation for a profitable swing trading strategy.
Ready to take your swing trading to the next level?
Use TradeSearcher to instantly backtest strategies and find the best indicators for your favorite tickers. Sign up today and start optimizing your trades!"